Network monitoring is both an art and a science, requiring careful planning and strategic implementation. In this first article of our two-part series, we'll explore how to set up IOTA for network monitoring and packet capture, laying the groundwork for the advanced filtering techniques we'll cover in our follow-up piece.
For our experienced users, this article dives into advanced IOTA filtering techniques.
Understanding IOTA's role in network monitoring
IOTA is a powerful network monitoring solution that enables precise packet capture and analysis. Think of IOTA as your network's watchful guardian, carefully observing and recording network traffic at crucial points in your infrastructure. Unlike traditional packet capture solutions, IOTA provides a REST API that enables programmatic control and automation of capture processes.
Strategic placement considerations
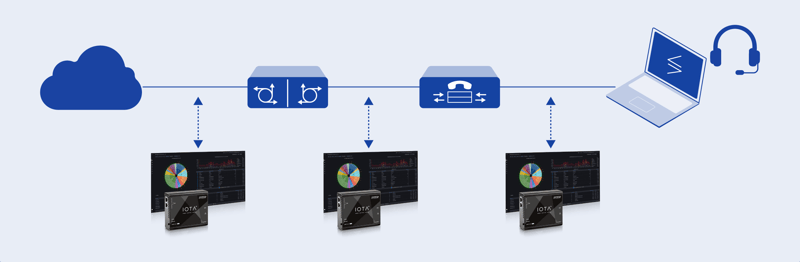
The effectiveness of your network monitoring largely depends on where you place your IOTA devices. Consider your network as a city's road system - just as traffic cameras are strategically placed at key intersections, IOTA devices should be positioned at critical network junctions. These typically include:
- The network edge, where your internal network meets the internet, is a primary monitoring point for detecting external threats and analyzing incoming traffic patterns.
- Position devices at major segment boundaries within your internal network to monitor inter-departmental traffic flows.
- For critical infrastructure segments, such as those housing financial applications or sensitive data, consider dedicated monitoring points to ensure comprehensive visibility.
Initial setup and configuration
Setting up IOTA begins with proper network interface configuration.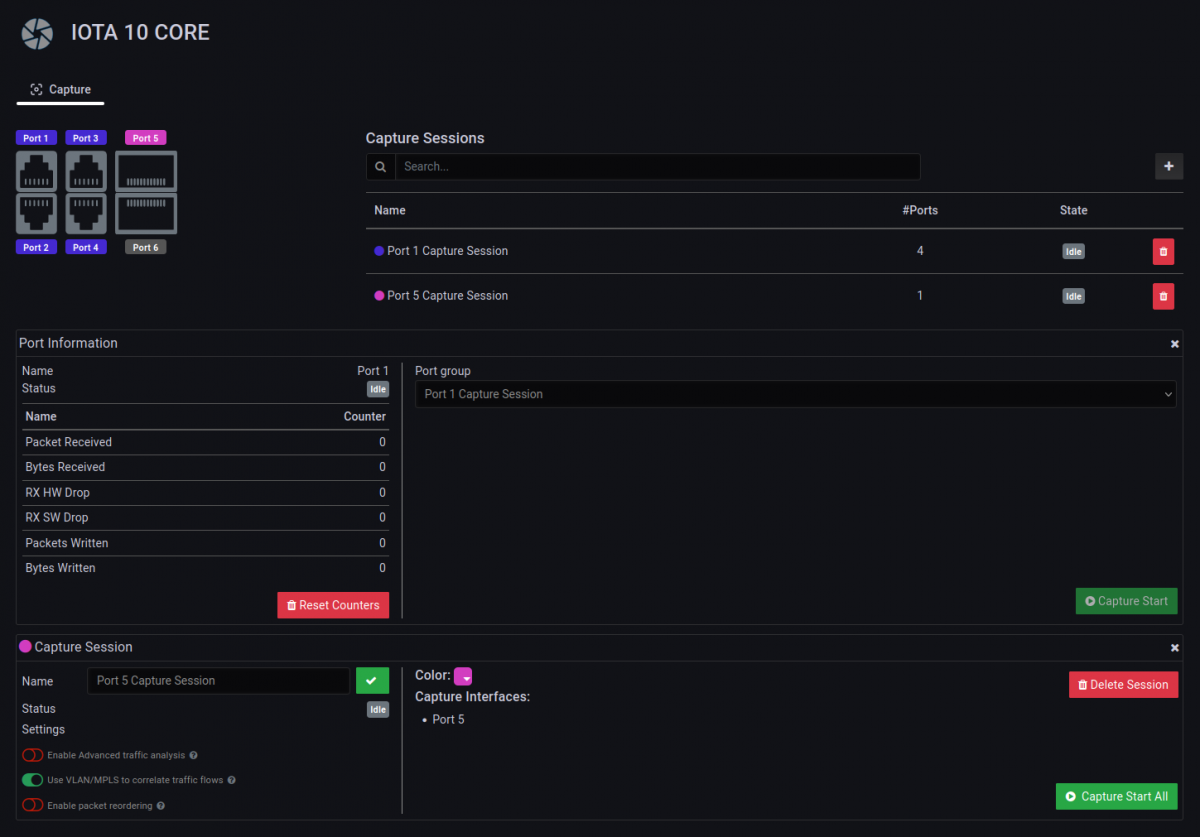
Your first decision should be whether to capture inline (breaking the existing network connection and inserting the capture interface between) or use an existing SPAN/mirror port. Additionally, the position and the physics of your network capture point are essential.
It is recommended to always use either an inline connection or a dedicated TAP for an inline connection. Using SPAN/mirror ports is sometimes the only choice, but it should be avoided if possible. When commencing packet analysis, the initial crucial decision revolves around the method of data capture. You have two primary options: capture inline or leverage an existing SPAN (Switched Port Analyzer) or mirror port.
Inline Capture:
Inline capture involves physically inserting the capture interface directly into the existing network connection. This means breaking the current network link and placing your capture device in between the two points of communication. This method offers the advantage of seeing all traffic flowing through that specific segment, ensuring no packets are missed due to port congestion or filtering. For this reason, it is often considered the most reliable method for comprehensive packet analysis.
SPAN / Mirror Port Utilization:
Alternatively, you can utilize a SPAN or mirror port. Most modern network switches offer the functionality to copy traffic from one or more source ports to a dedicated destination port (the SPAN or mirror port). Your capture device then connects to this destination port. While convenient, as it doesn't disrupt the live network connection, this method has potential drawbacks. The SPAN port itself can become a bottleneck if the aggregate traffic from the source ports exceeds the destination port's capacity, leading to dropped packets. Furthermore, some switches may filter certain types of traffic (e.g., multicast or broadcast traffic) during mirroring, which could result in an incomplete view of network activity.
Position and Physics of the Network Capture Point:
Beyond the chosen method, the physical location and characteristics of your network capture point are paramount.
- Location: The strategic placement of your capture device is critical to observing the specific traffic you intend to analyze. Placing it at the network edge will show traffic entering and exiting your network, while placing it deeper within the network will reveal internal communications.
- Physical Connectivity: Considerations include the type of cabling (e.g., copper or fiber-optic), the speed of the network link (e.g., 1 Gbps, 10 Gbps, 40 Gbps, 100 Gbps), and the transceivers or interfaces required by your capture device to match these specifications.
Recommendations for Optimal Packet Capture:
For the most accurate and complete data, it is strongly recommended to always:
- Go Inline: Whenever feasible, directly inserting your capture device into the network path is the preferred method. This provides the highest fidelity in capturing all traffic without the potential for packet loss or filtering that can occur with SPAN/mirror ports.
- Use a Dedicated TAP for Inline Connection: For robust, non-intrusive inline capture, a dedicated Test Access Point (TAP) is highly recommended. A network TAP is a hardware device that creates a copy of the network traffic without introducing any latency or potential points of failure to the live network. Unlike a direct inline capture that requires breaking and re-establishing the link, a TAP typically sits permanently in the network and passively copies traffic, ensuring that the live link remains undisturbed. TAPs are available for various network speeds and media types and are crucial for critical network segments where downtime is unacceptable.
While using SPAN or mirror ports can sometimes be the only practical choice due to infrastructure limitations or the need for non-intrusive monitoring, it should generally be avoided if more reliable inline or TAP-based methods are available. The potential for packet loss, incomplete data, and the inability to guarantee an exact copy of the traffic make them less ideal for detailed forensic packet analysis than dedicated inline solutions.
Establishing your baseline
Before diving into active monitoring, establishing a network traffic baseline is crucial. Think of this as taking your network's vital signs during regular operation. A solid baseline helps you distinguish between normal traffic patterns and potential anomalies.
Start by conducting capture sessions at different times of the day and on various days of the week. Pay particular attention to:
- Network utilization patterns during peak business hours versus off-hours which provides insights into normal traffic fluctuations.
- Application-specific traffic patterns help identify typical behavior for critical business applications.
- Protocol distribution across your network, to give you a clear picture of how different services utilize your bandwidth.
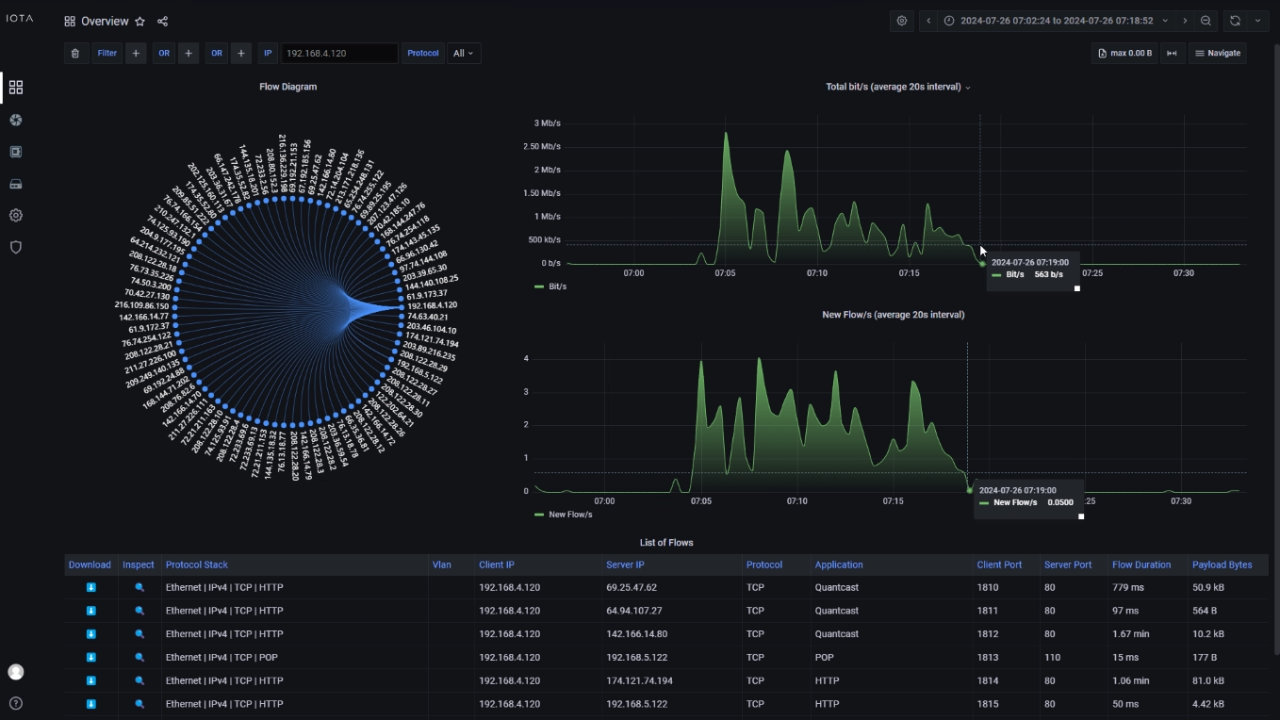
Time-series graph showing typical daily traffic patterns with annotations for key business hours and activities
Target selection and monitoring strategies
Selecting appropriate monitoring targets requires balancing comprehensive coverage and focused observation. Rather than capturing everything everywhere, identify critical data flows that align with your monitoring objectives. For instance, if you monitor security threats, focus on edge traffic and internal-to-external communications. For application performance monitoring, target the network segments where your critical applications operate.
Performance considerations
IOTA's performance depends mainly on proper configuration and resource allocation. Monitor the device's resource utilization and adjust capture parameters accordingly. The key is to find the sweet spot between comprehensive monitoring and system performance:
def can_start_capture(interface_status):
    return (
        interface_status['physical_state']['state'] == 'idle' and
        not interface_status['capture_enabled']
    )
This code snippet demonstrates how to check if an interface is ready for capture, helping prevent resource overutilization.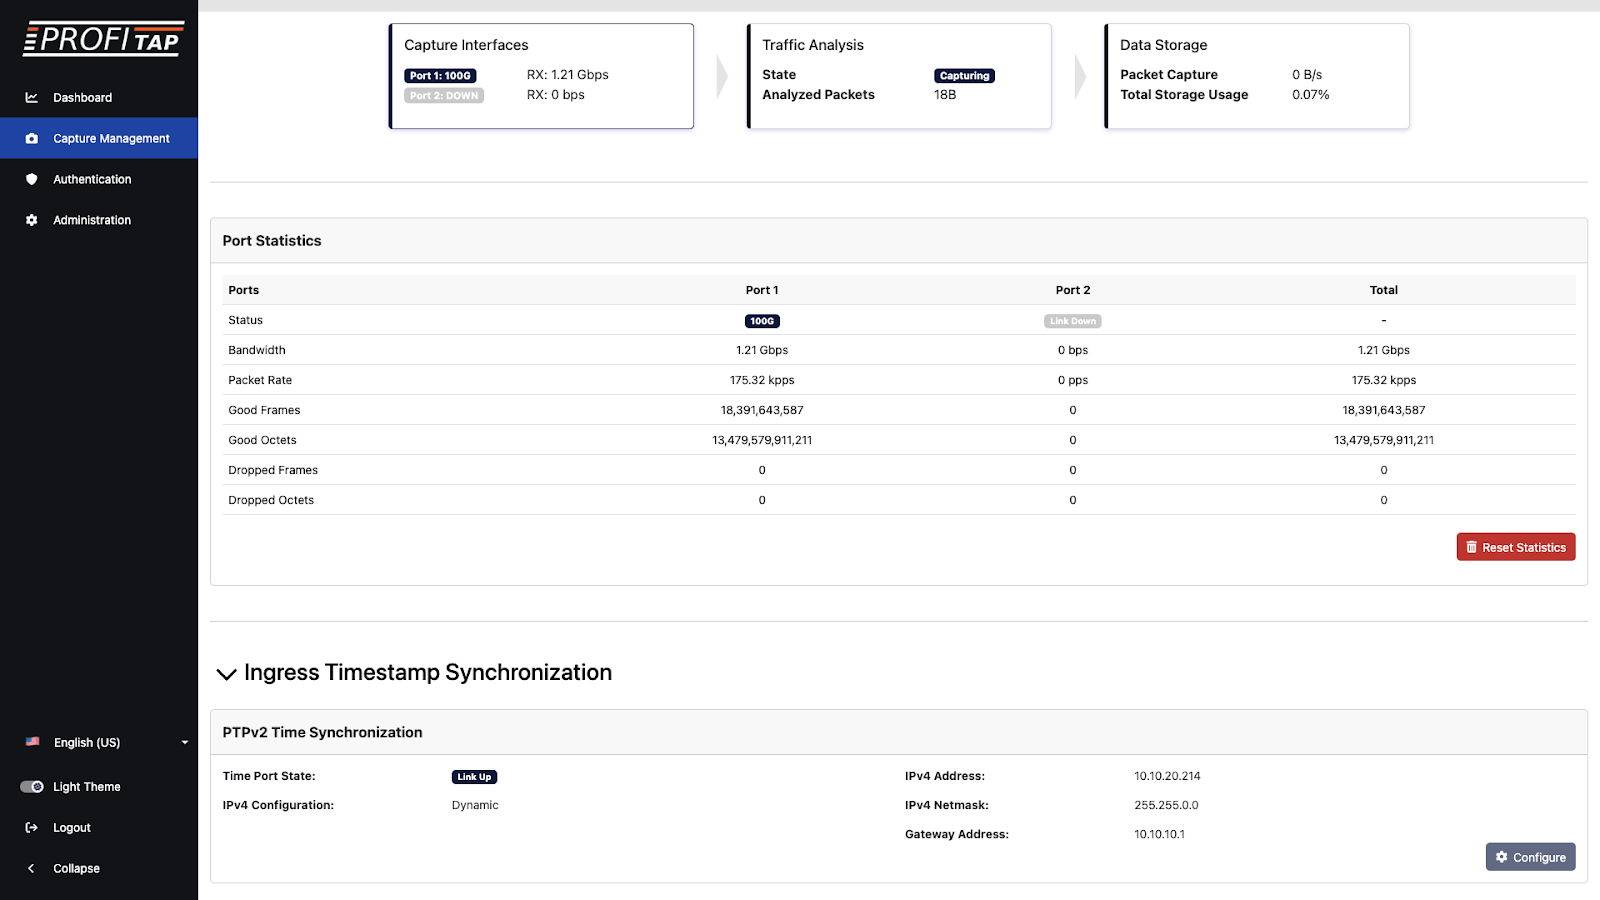
IOTA 100 CORE capture management settings, resource utilization dashboard showing CPU, memory, and storage metrics with optimal ranges highlighted
Looking ahead
In our next article, we'll dive deep into advanced filtering techniques to help you maximize your IOTA deployment. We'll explore how to create precise capture filters, complementary analysis of packet data with Wireshark, and derive meaningful insights from your captures.
Until then, focus on:
Experiment with different IOTA placement scenarios in your network to find optimal monitoring points. Develop comprehensive baselines for other network segments and time periods. Familiarize yourself with the IOTA REST API and its capabilities for automated monitoring management.
For further reading before our next article, explore topics such as network flow analysis, traffic pattern recognition, and basic Wireshark usage. These fundamentals will enhance your understanding of the advanced filtering techniques discussed in part two of this series.
Remember, effective network monitoring is an iterative process. Use this time between articles to experiment with different setup configurations and observe how they affect your monitoring capabilities. Document your findings and challenges - they'll be valuable reference points when we explore advanced filtering techniques in our next installment.
For our experienced users, this article dives into advanced IOTA filtering techniques
| IOTA EDGE (1G / 10G) | IOTA CORE (10G / 100G) | IOTA CM |
 |
 |
 |
|
|
|

|

|

|
