Someone called and said “Clients are complaining about application performance issues”. In other words, ‘things are slow’. I’m sure that this is a common statement heard by most IT technicians.
I asked for a meeting with the client and the IT team to discuss the issue. I needed to determine when the problem started, how often it happens and if they can reproduce the issue at will. During our meeting we found out that the issue has been occurring since day one (over a year ago), only getting worse and the client can reproduce the problem 9 out of 10 times.
Some of the team members thought the issue was related to the latency caused by their WAN connection to their server farm. I asked what they did to prove or disprove the latency theory. They commented that they pinged the remote server and router. Since there was no packet loss or latency issues, the WAN equipment, path and server must be fine. The ping test did have some value but I explained that a ping is by default a small packet, does not use TCP or UDP and is not the same as an application request so further testing is required.
My ‘gut’ tells me that since the client can reproduce the performance problem and other applications are fine, I doubt it is network related, but I need to prove it.
The other concern I have using an Ethernet TAP on an unknown network is that my computer might drop packets. Even if I don’t drop any packets, a broadcast storm could skew my packet latency. During our meeting the network team said the average utilization on the client port is about 11%. 11% of 1 Gb is 110 Mbps which can easily cause issues with my capture.
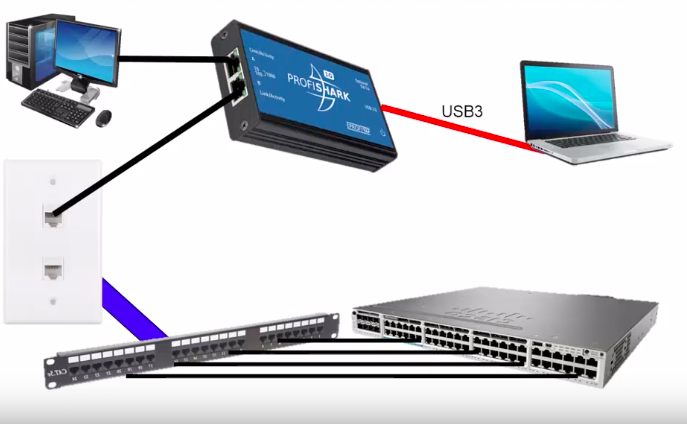
Even though I replaced WinPcap with NPCAP on my system, I don’t feel comfortable gambling that my laptop can keep up with the network, or provide accurate timestamps. Through vigorous testing in my lab, I know my ProfiShark won’t drop a packet and has accurate timestamps at 1 Gb with 64 Byte Packets.
One of the network analysts suggested setting up a SPAN port but I explained that I recommend against that since we are working on a performance issue. I don’t want the possibility of the span port adding latency or causing any other issues.
I’m not sure how well the switch is working, or if the switch is contributing to the problem, so I prefer we not initially modify any network device configurations. In some cases, a switch configuration change can take weeks to implement if change management approval is required.
Since the boot up and login did not have any major issues, I jumped straight to the application baseline. I started with reviewing some sample TCP SYN ACK and Application response time measurements. Then I quickly looked through the trace to see if there are any breaks in the initial pattern. In some cases, the Statistics -> IO graph is helpful in identifying a change in packets/sec or bits/sec. I simply clicked on the peak or valley to jump to those packets.
One of the first thing I do when analyzing this trace file is to look for any common issues that would cause performance issues. Here is a quick list of some of the things I look for:
- Name server performance issues (DNS, LDAP, WINS)
- Small packets used during hi volume transactions
- TCP retransmissions
- UDP dropped packets
- ICMP or application ERROR messages
- Excessive delays
That last one “Excessive Delays” is a tough one. Ideally you want to compare a good and bad trace. So, what do you do when you do not have a baseline or good trace to reference?
I covered all of these and as how to configure your protocol analyzer in the following video:
Please keep in mind where the trace was taken. In this case, it was from the client. If we see delays from the server, keep in mind it may not be the server, it could be anything between the client and the server. If we had the time and resources, I would have taken a trace from the server.
Lastly, we did find that the server was sized properly and the administrator found that the server needed more RAM and CPU’s.
With this application, I can clearly see that the SQL server is the main source of latency and created a table comparing the response times from other servers or services used by the client. I find summary tables like this helpful to ensure that all team members understand what server or device we will focus on.
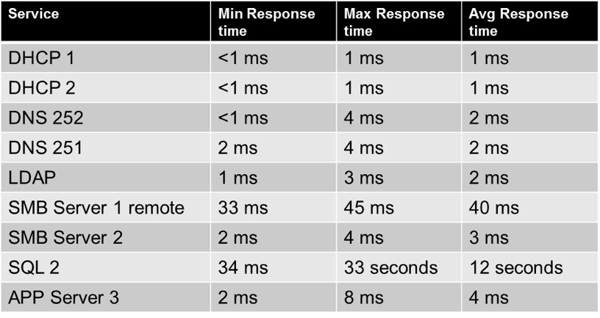
When identifying sources of high latency, it is important to remember your capture point. For example, the SQL server seems to be the source of high latency, but since we are capturing from the client, all we can conclude is that the latency is not at the client and ‘towards the SQL Server”. I have to be careful since we do not have a trace from the server, and I am not aware of what network devices are between the client and server. This statement could simply mean that we need to perform more captures along the path between the client and server.
After seeing this table, the server team looked at the SQL server more closely. They found issues in the SQL/Server log so a capture from the server does not seem required at the point in time. They adjusted certain settings, such as number of CPUS, RAM and database size. They also determined the database has never had their regular maintenance performed so things like reindexing was scheduled.
I noticed portions of the software where many smaller packets were used instead of the larger fewer packets when the client is performing other tasks. I sat down with the in-house programmers and they appreciated the feedback since I could show the exact commands. This change is more of a longer term issue, but at least they can compare the impact of any code changes to this trace.
Lastly, I trained the group in Wireshark and protocol analysis as I went through the trace. I had my computer connected to a projector and when I found something interesting, I would show the group my findings and my workflow. This is one of my favorite classroom approaches, live traces with the network team. I learn about their network and IP addressing and they learn about how I do my network troubleshooting, Wireshark and protocol analysis.
The article is written by Tony Fortunato - Network Performance Expert and Packet Analysis Hero