Analyzing network behavior and troubleshooting network issues is like going through a funnel. Ultimately, you go from a wide-angle perspective down to microscopic detail. Wireshark, a well-known network protocol analyzer, helps network engineers do exactly this. It helps them filter specific data segments, such as particular IP addresses, values, or protocols, making the troubleshooting process more manageable.
Starting with a capture or trace file of your network’s traffic, filters can be applied to narrow down your search to specific data segments, such as particular IP addresses, values, or protocols, making the troubleshooting process more manageable.
-1.png?width=800&height=573&name=image%20(4)-1.png)
Wireshark Filters: Essential Tools for Network Analysis
We put together a list of useful filters to make data analysis more efficient. These filters, applicable to both live captures and imported files, enable precise examination of protocol fields and data stream HEX values, tailored to the unique needs of each troubleshooting scenario. Here are their top picks:
ip.addr == x.x.x.x
Filters packets with a specific IP address as either the source or destination. Ideal for analyzing traffic to and from a particular IP.
ip.addr == x.x.x.x && ip.addr == y.y.y.y
Narrows down communication between two IP addresses, streamlining data analysis. Wireshark keeps track of specific conversations between endpoints on various levels of the protocol stack and lets you filter explicitly for those. Take a look at the Statistics->Conversations dialog to get a list of conversations that are part of the currently open trace.
http or dns
Focuses on HTTP and DNS protocols, facilitating the investigation of web traffic and domain name resolutions.
tcp.port == xxx
Isolates TCP packets by specific port numbers, simplifying the examination of traffic through designated ports. If you need to filter for multiple ports you can also supply a list of values to filter for: tcp.port in {80, 443}. This will filter for all traffic either on port 80 or 443.
tcp.seq == x
Filters packets by TCP sequence number, useful for analyzing data packet order.
tcp.flags.reset==1
Reveals all TCP resets, crucial for identifying abrupt connection terminations.
tcp.flags.push == 1
Identifies TCP push events, significant for troubleshooting data flow issues.
tcp contains "keyword"
Displays TCP packets containing specified terms, aiding in content-specific searches. Note, that the string within the quotes will be escaped. Therefore searching for a file-patch may yield unexpected results. To avoid this, one can also force the search to avoid escaping the content, e.g.: tcp contains r"C:\foo"
tcp.stream eq X
Follows a particular TCP stream, allowing for continuous packet tracking. To see an overview of all streams available in a specific trace, the Statistics->Conversations dialog can be used.
http.request
Captures HTTP GET and POST requests, highlighting web page access patterns. Specifically it will capture all packets, where the field http.request is present. If only a specific request should be filtered for, it can be specified accordingly: http.request.method in {"POST", "PUT"}
!(arp or icmp or dns)
Excludes specified protocols, focusing the analysis on relevant traffic.
udp contains xx:xx:xx
Filters UDP packets by HEX values, useful for pinpointing specific data segments.
dns.flags.rcode != 0
Identifies DNS requests with resolution errors, crucial for diagnosing domain name issues.
tcp.payload[0:2] == bb:cc
Filters the payload field for all messages that contain bb:cc as the first two bytes. This can be used in various places, eth.addr[0:3] == 00:11:32 will filter all traffic originating from a NIC with a Synology vendor ID for instance.
Don't forget to check The Evolution of Portable Packet Capture Solutions article if you want to learn more about a portable network capture solution that flawlessly integrates with Wireshark.
Pro tips
1. Did you know that you can add often-used filters as a button?
The little + on the right side of the address bar allows for the creation of so-called “Filter Buttons”. Those buttons can be used as shortcuts for often-used display filter expressions.
New buttons can be added by either dragging a field directly onto the + sign or by clicking it when a filter is applied. In the latter case, it will automatically add the current filter to the creation dialog and all that is needed is to provide a name for the button. By adding two slashes // to the name, the buttons can even be grouped together.
2. Did you know that you can drag and drop filters?
Instead of just copying the filters it is easier just to drag a filter into the search bar.
In this video Chris greer explains the drag and drop capability in 2 minutes.
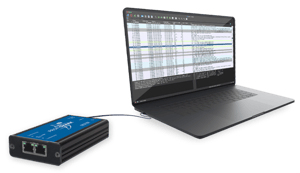
Capturing actionable network data
Network packets can make or break your troubleshooting process. One key advantage of network packet capture is the level of detail it provides. Capturing all information within a packet, including its source and destination addresses, protocol information, and payload data, allows for a more thorough analysis of network traffic, making it an invaluable tool for troubleshooting network issues.
Packet capture tools like the ProfiShark or IOTA have advanced features such as hardware timestamping and hardware capture filters, delivering high-fidelity capture files for analysis.
|
 |

|

|
|
High-performance field packet capture for on-site troubleshooting and industrial networks.
|
Traffic capture & analysis in a single box. Small/mid-size enterprises and data centers.
|
