In our remote network analysis blog, we mentioned deploying multiple EDGE IOTAs in different branch locations for a comprehensive overview across all distributed networks. Here, we’ve laid out a different deployment scenario.
In larger networks, there can be many capture points of interest throughout the network architecture. Deploying network TAPs and NPBs to aggregate traffic from the capture points into a single high-speed IOTA CORE model can be beneficial.
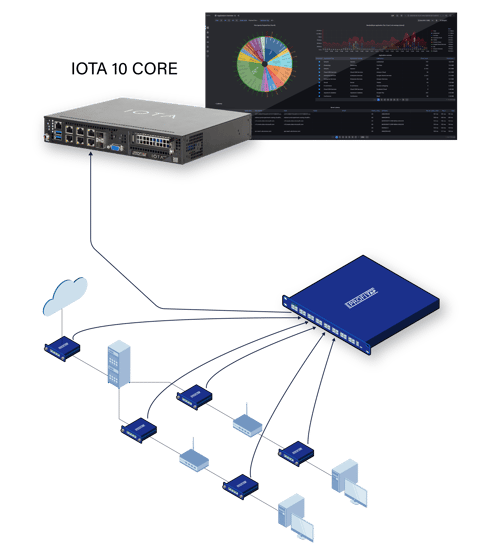
As illustrated above, multiple TAP capture points connected to the Network Packet Broker (NPB), funnel the traffic to the IOTA. The network TAPs ensure a lossless copy of the network traffic is available without impacting the network performance and security. Network Packet Brokers makes pre-filtering possible, allowing for the ‘noise’ reduction of useless/trivial data. After aggregation, traffic can be stored in the IOTA on the internal SDD (up to 16 TB) for historical analysis.
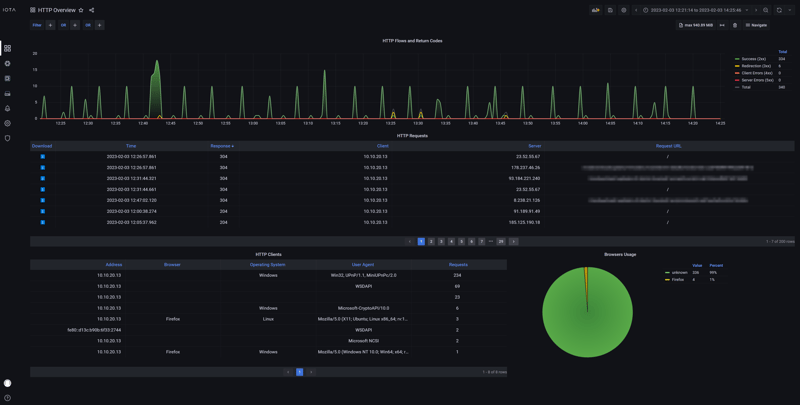
IOTA is quick and easy to deploy and configure. We provide detailed information on implementing the device and configuring the dashboards to your needs in our knowledge base. The integrated dashboards provide detailed network traffic visibility and help quickly analyze critical applications and data. Many network parameters are available to you: VoIP, HTTP, Local Assets, Microburst, Modbus, SSL/TLS, TCP, Bandwidth, DNS, Host Details, etc.
Whether you have nothing yet or already have network TAPs & NPBs, IOTA can contribute to your network troubleshooting capabilities. Check out the whole lineup on the IOTA page and read the data sheets on their respective product page.
