IOTA firmware version 3.0.0 was recently released. It includes the following changes:
- Redesign IOTA GUI to use new metadata engine;
- Redesign the default dashboard to include a graphical flow diagram of network nodes;
- Redesign VoIP dashboard to provide complete correlation between VoIP control and data traffic;
- Add VXLAN support in traffic analysis;
- Add mDNS and NetBIOS based hostname resolution in traffic analysis;
- Add independent PCAPNG import analysis queue;
- Add Analysis Sessions dashboard to help navigate between session time ranges;
- Add Application Overview dashboard with payload and latency based visualization;
- Add Local Assets dashboard displaying nodes within local subnets;
- Add Host Details dashboard with host-specific metrics;
- Add Flow Details dashboard with flow-specific metrics;
- Add MOS calculation for VoIP traffic;
- Add support for OR filtering on dashboard and exported PCAPNG;
- Improve HTTP dashboard to display user agent information;
- Improve DNS Overview dashboard with correlation between DNS queries and related traffic;
- Improve SSL/TLS Overview dashboard to evaluate SSL/TLS server configuration;
- Improve TCP Analysis to include traffic flow characterization;
- Improve metadata analysis to detect VLAN tags and MPLS labels inside tunneled traffic;
- Improve PCAPNG export function to preserve original interface names;
- Hardening device HTTPS configuration;
- Fix automatic cleanup for files with special characters;
- Fix VLAN tag filtering for MAC-in-MAC traffic.
You can download the update either from the IOTA GUI (IOTA Settings > Firmware & License) or from: iota.profitap.com.
For more information on updating the firmware on IOTA, visit kb.profitap.com/iota/installation-and-configuration/firmware-update
Updated dashboards
Below is a selection of updated dashboards in IOTA v3.0.0 with a short description. To see all new dashboards, visit profitap.com/iota.
Overview dashboard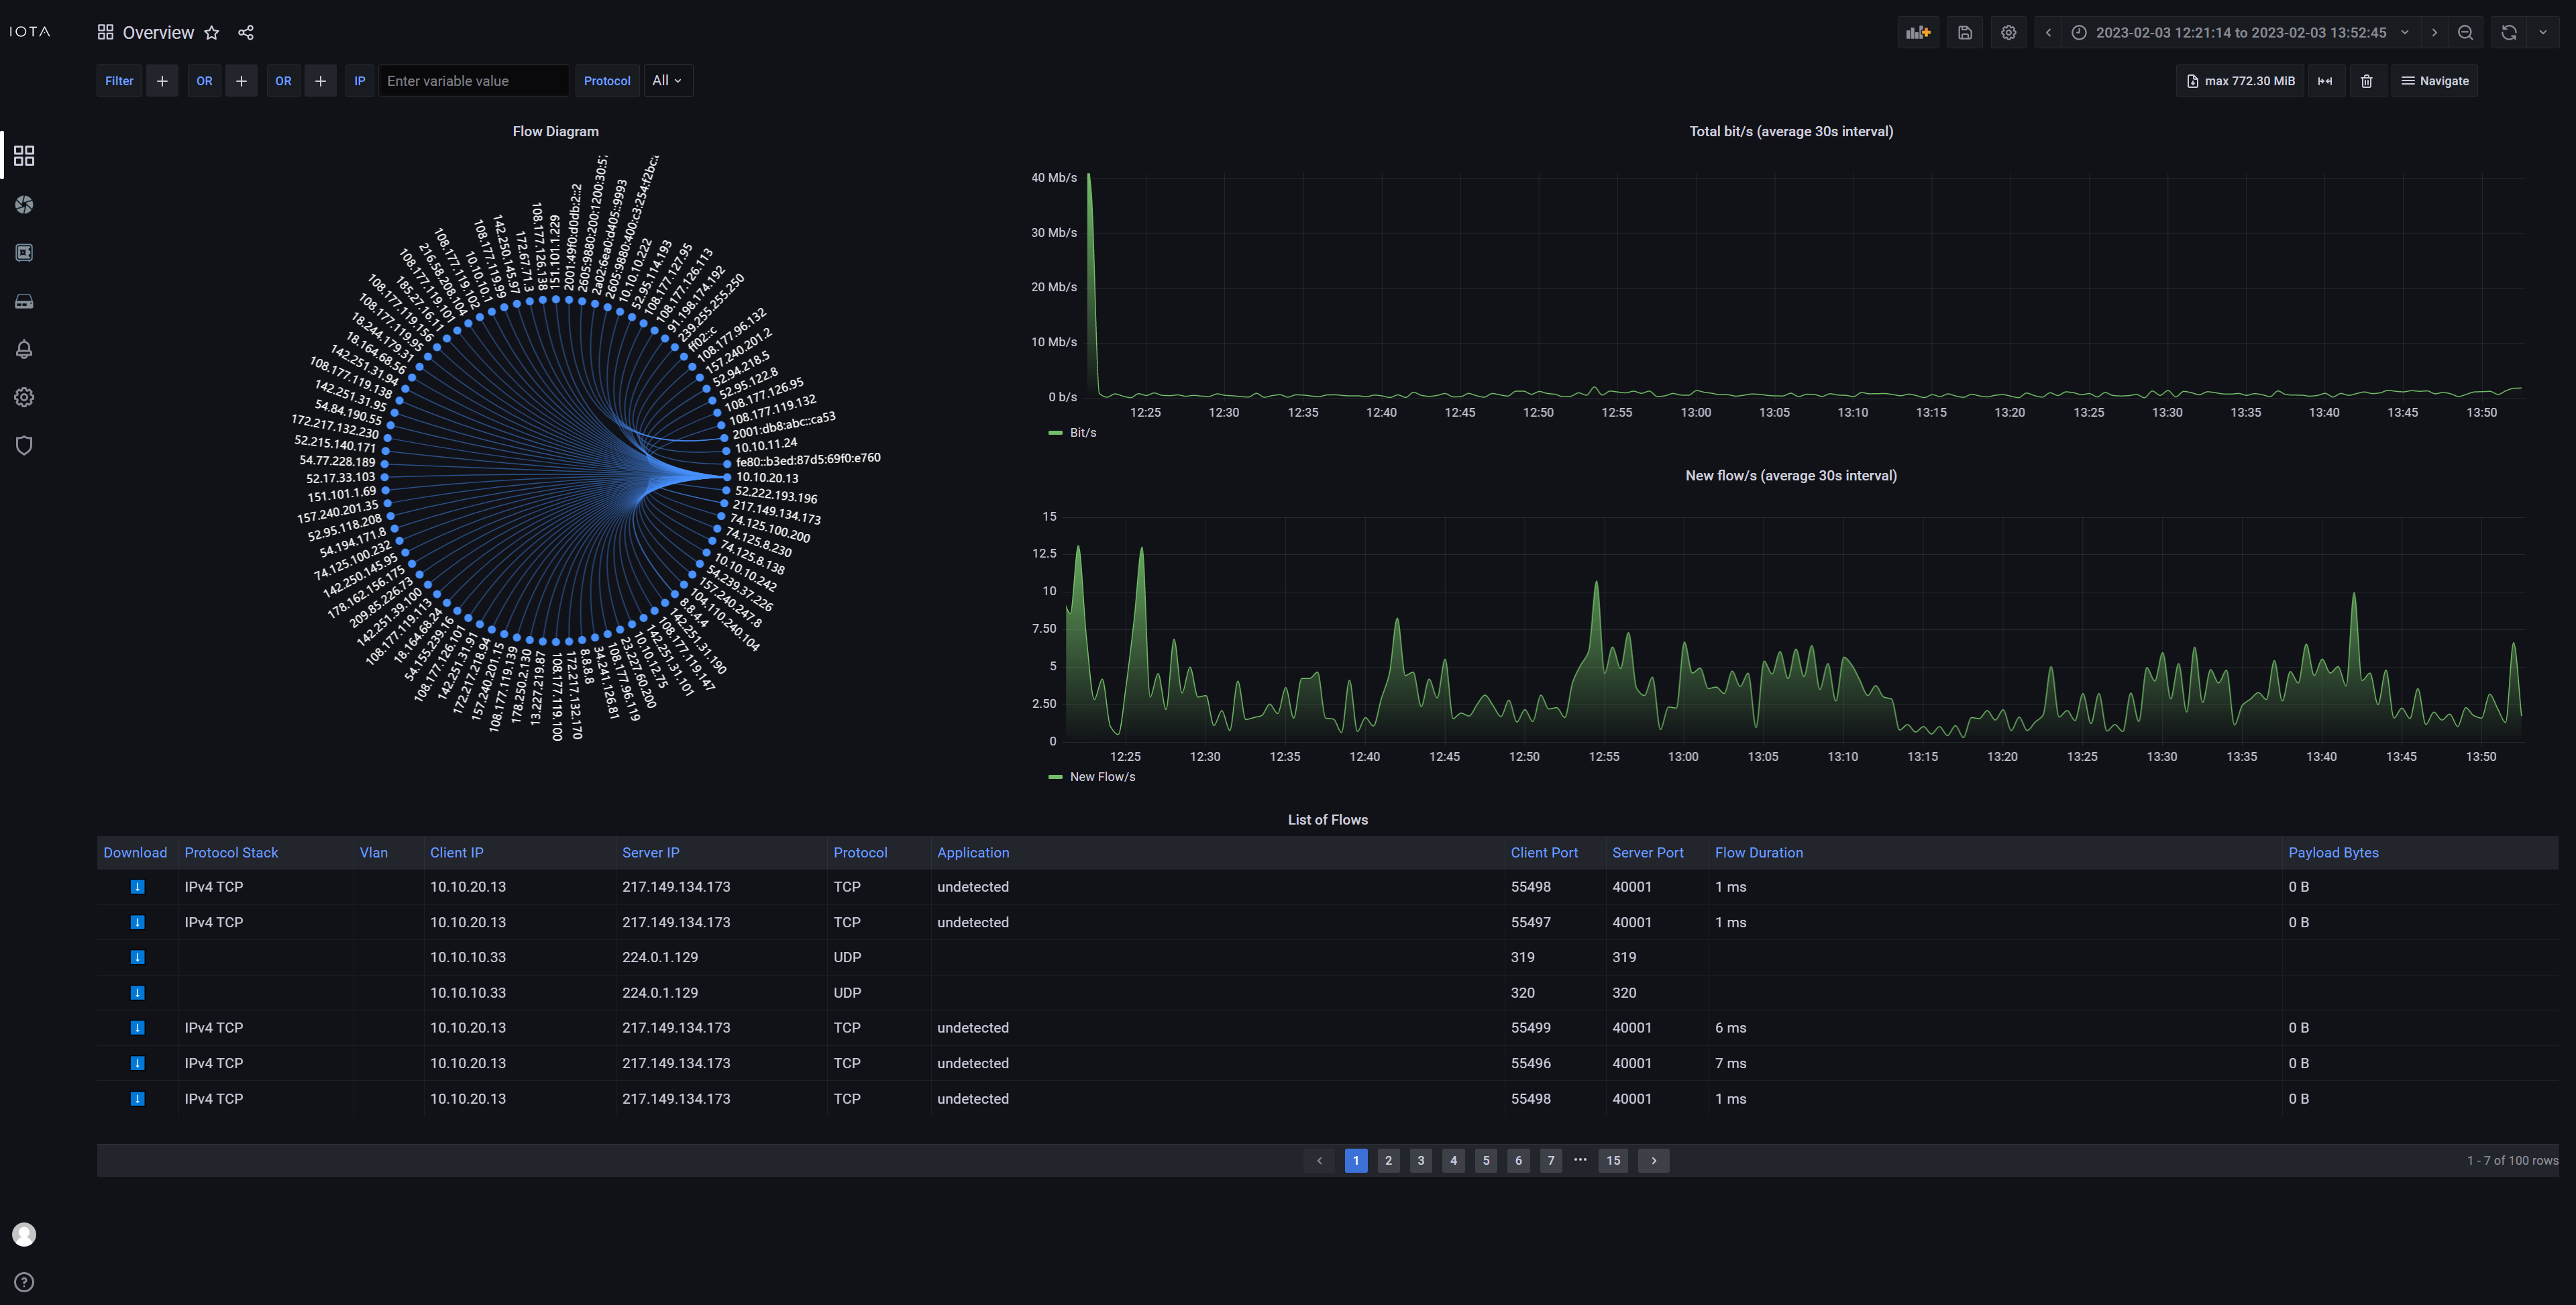
The Overview dashboard gives you a quick initial overview of what is happening on your network by displaying the interfaces involved, who is talking to whom, and how much. The flow diagram is a visual representation of the relationships between interfaces, which helps you to easily identify the top talkers. Clicking an IP address in this diagram creates a dashboard filter, resulting in the dashboard only displaying data involving this IP address. The network traffic charts displaying bandwidth usage and number of new flows over time are a great way to identify potential time ranges of interest. Clicking and dragging on either chart zooms in on the selected time range.
Application Overview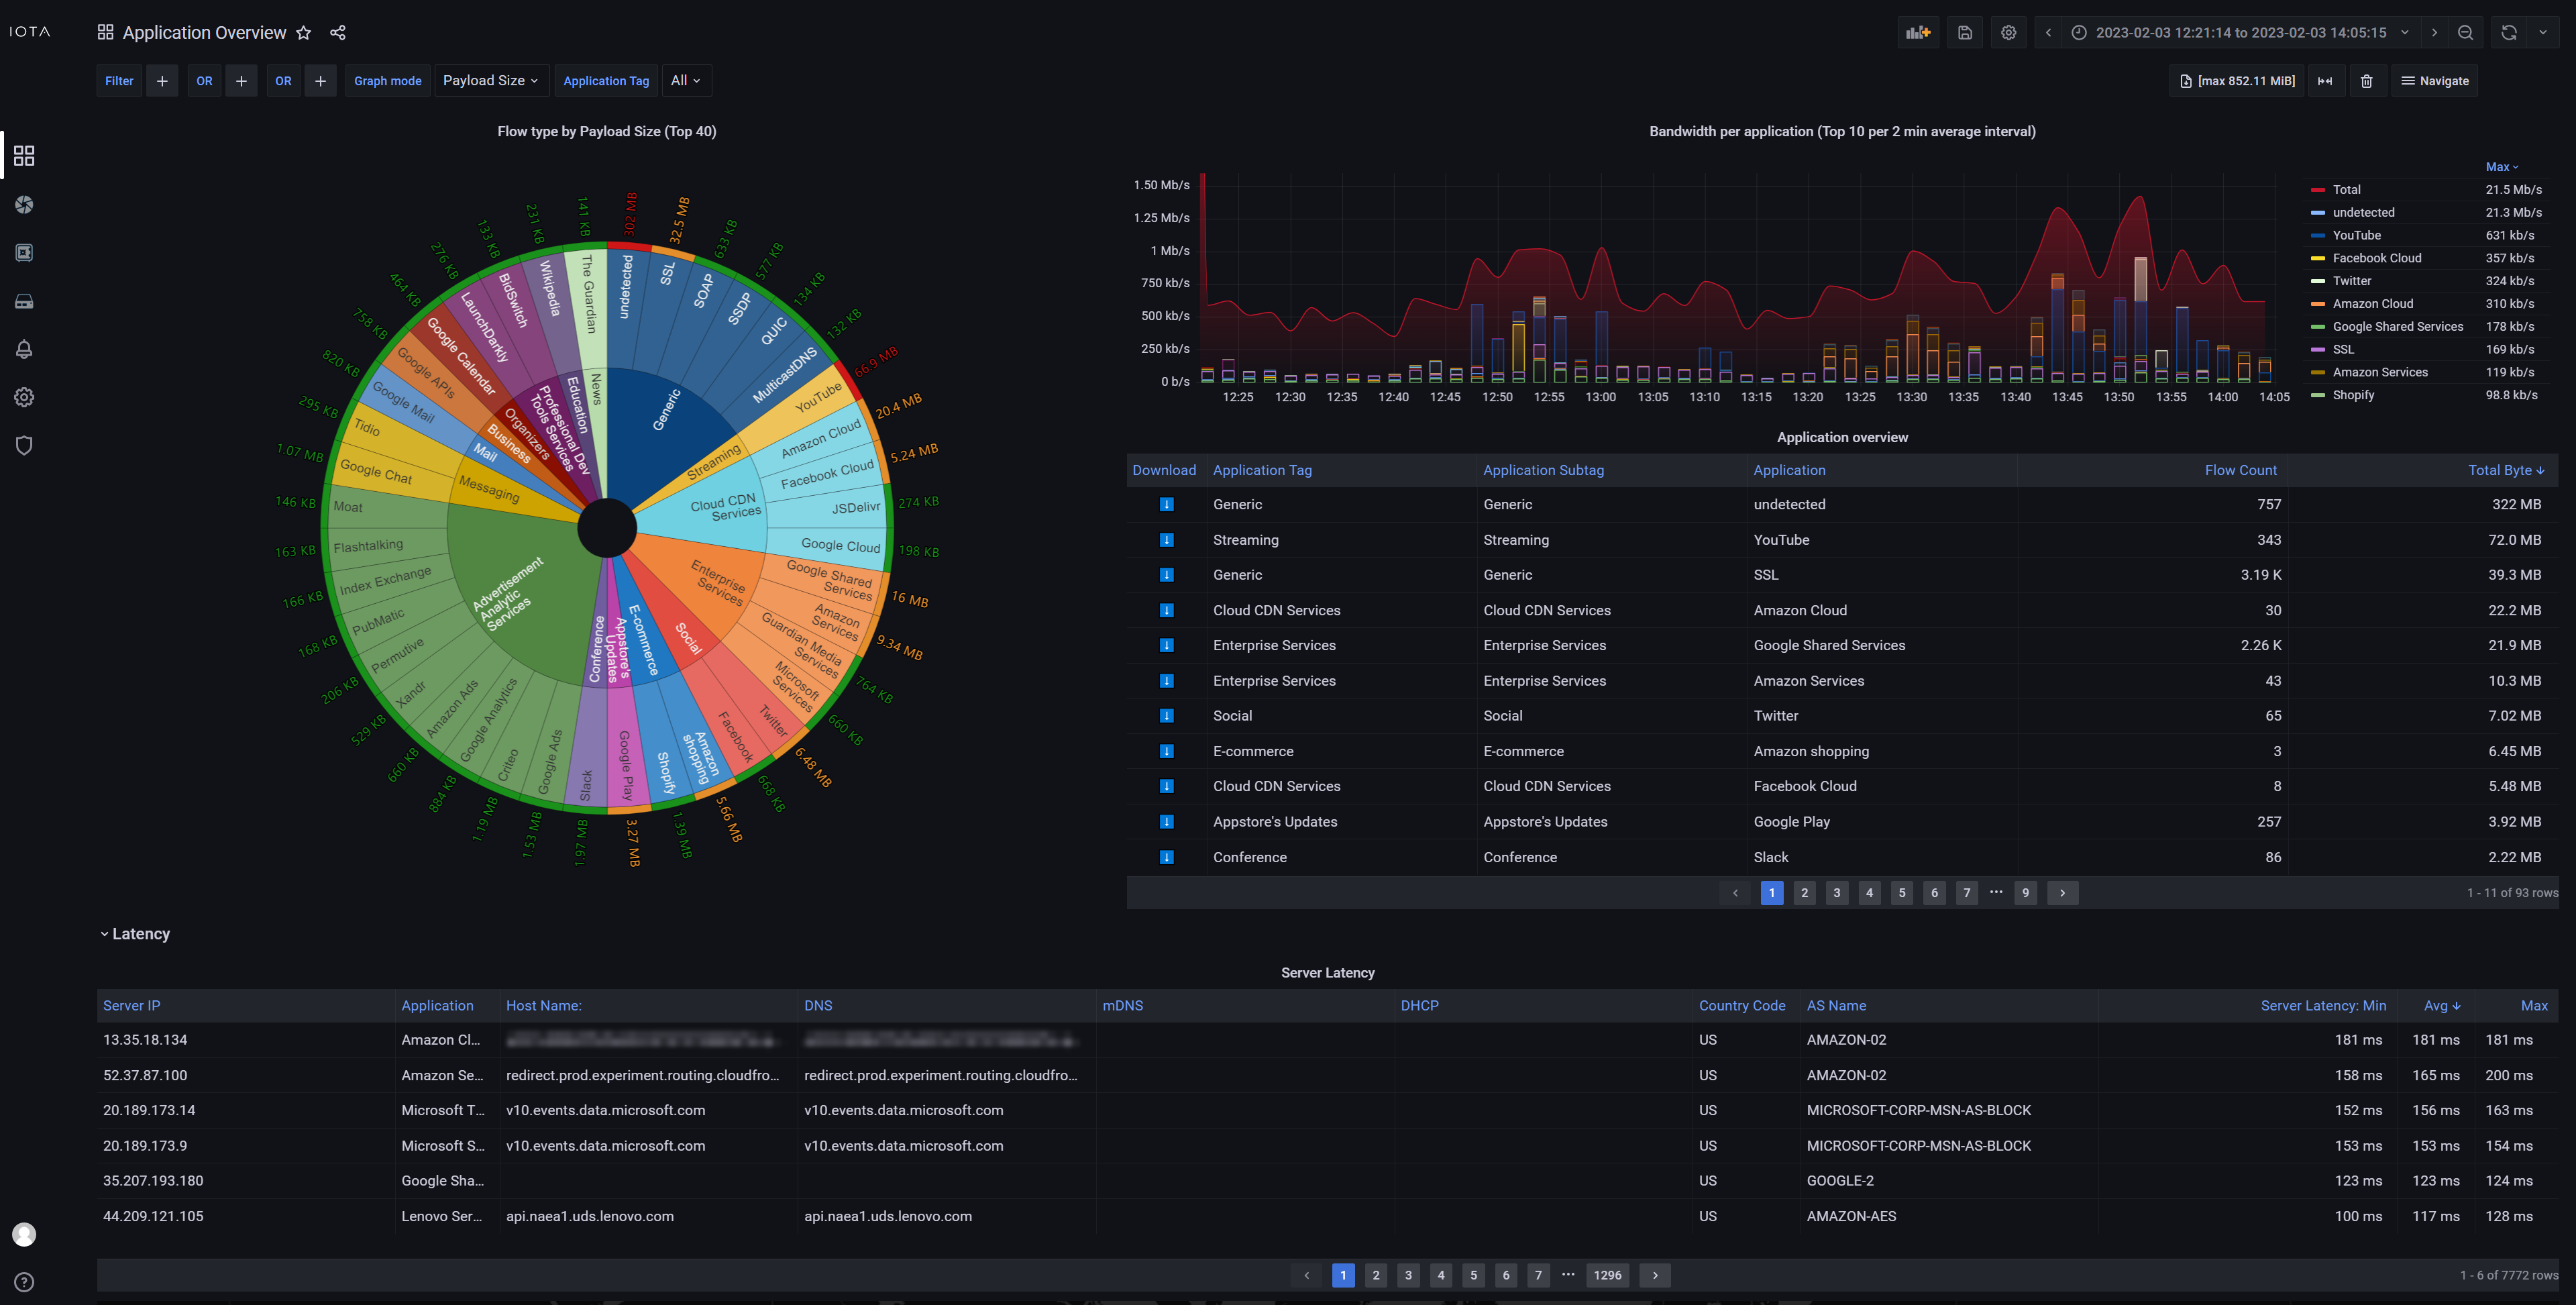
Where the Overview dashboard shows who is talking to whom, the Application Overview dashboard shows what they are talking about. The data in this dashboard is categorized by application type, and by application. The graph can be changed to display latency, flow count, and payload size. This dashboard is a great starting point when analyzing application issues. It gives a clear overview of which components may be slowing your applications down. It can also help finding unexpected services, and services consuming too much bandwidth.
VoIP analysis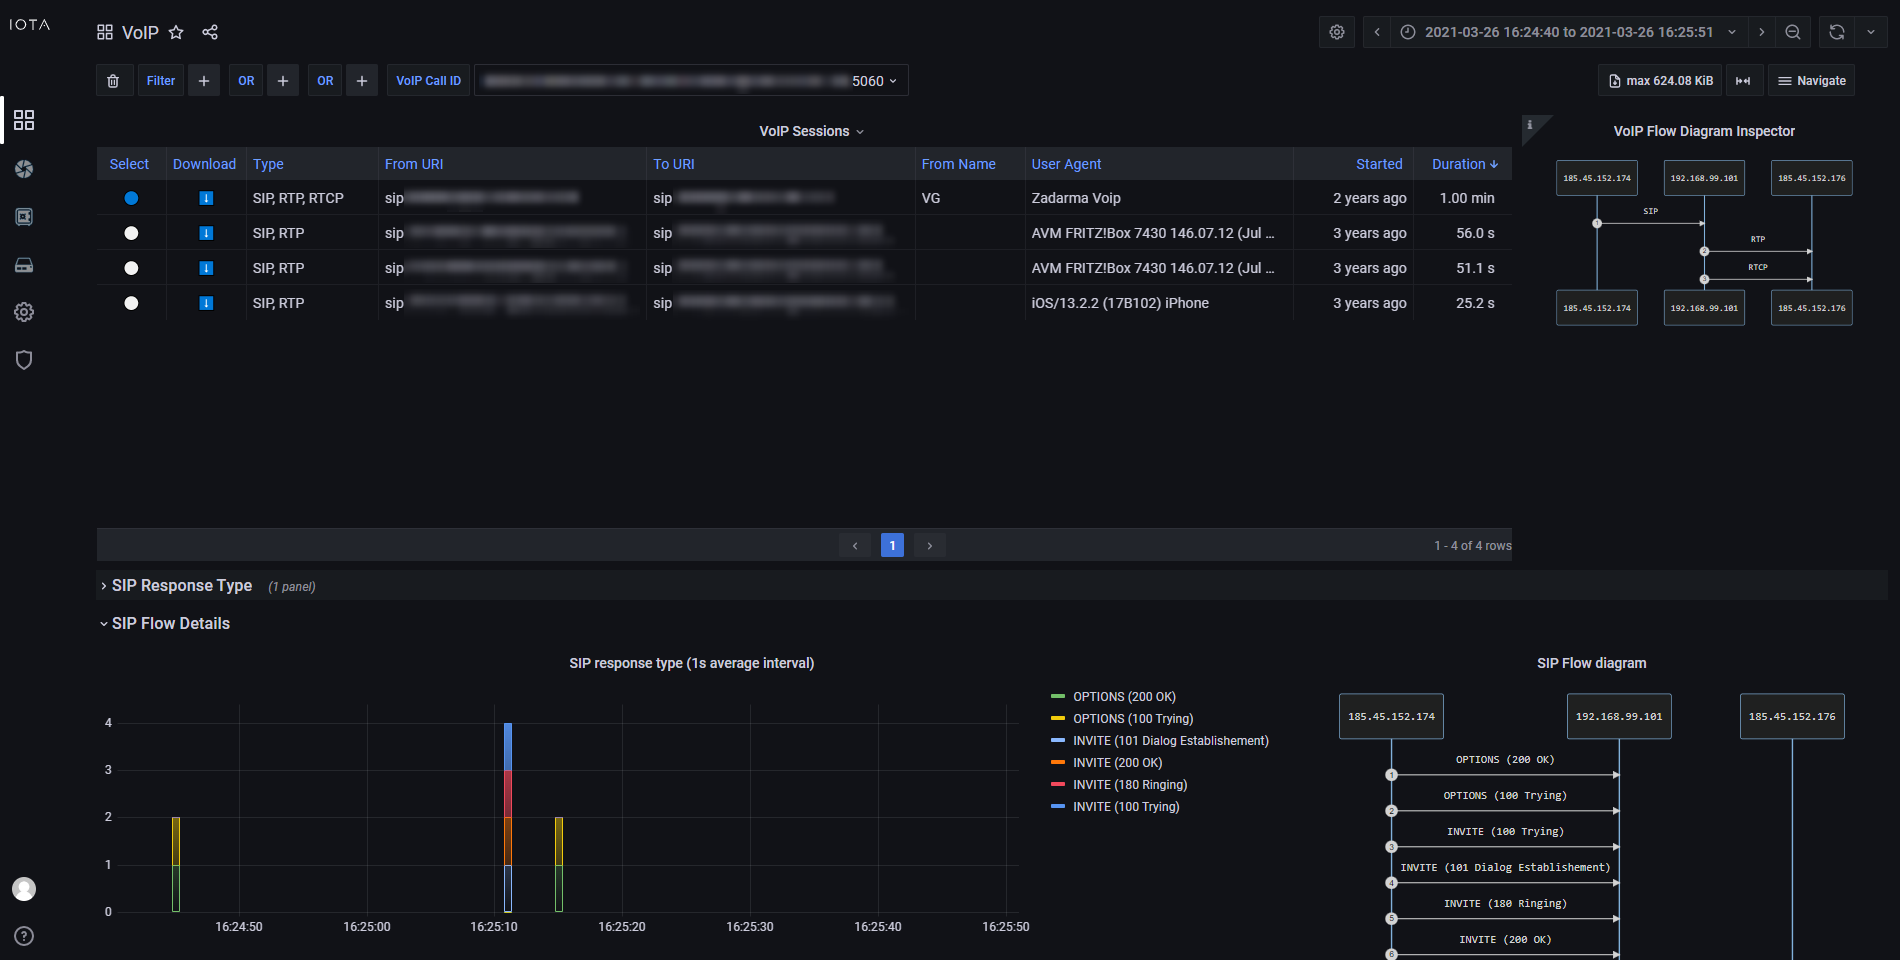
The VoIP dashboard provides an overview of recorded VoIP sessions, with the possibility to dig down on SIP and RTP metrics and details.
The VoIP Sessions table provides a complete view of detected sessions with cross-correlation between control and data traffic. From this table, selecting a specific VoIP session is possible, allowing inspection of session-specific details in the various dashboard sections.
The call flow is visualized in VoIP and SIP flow diagrams, to help get a better overview of the call details. The dashboard also provides MOS scores for a quick indication of call quality.
Microburst Analysis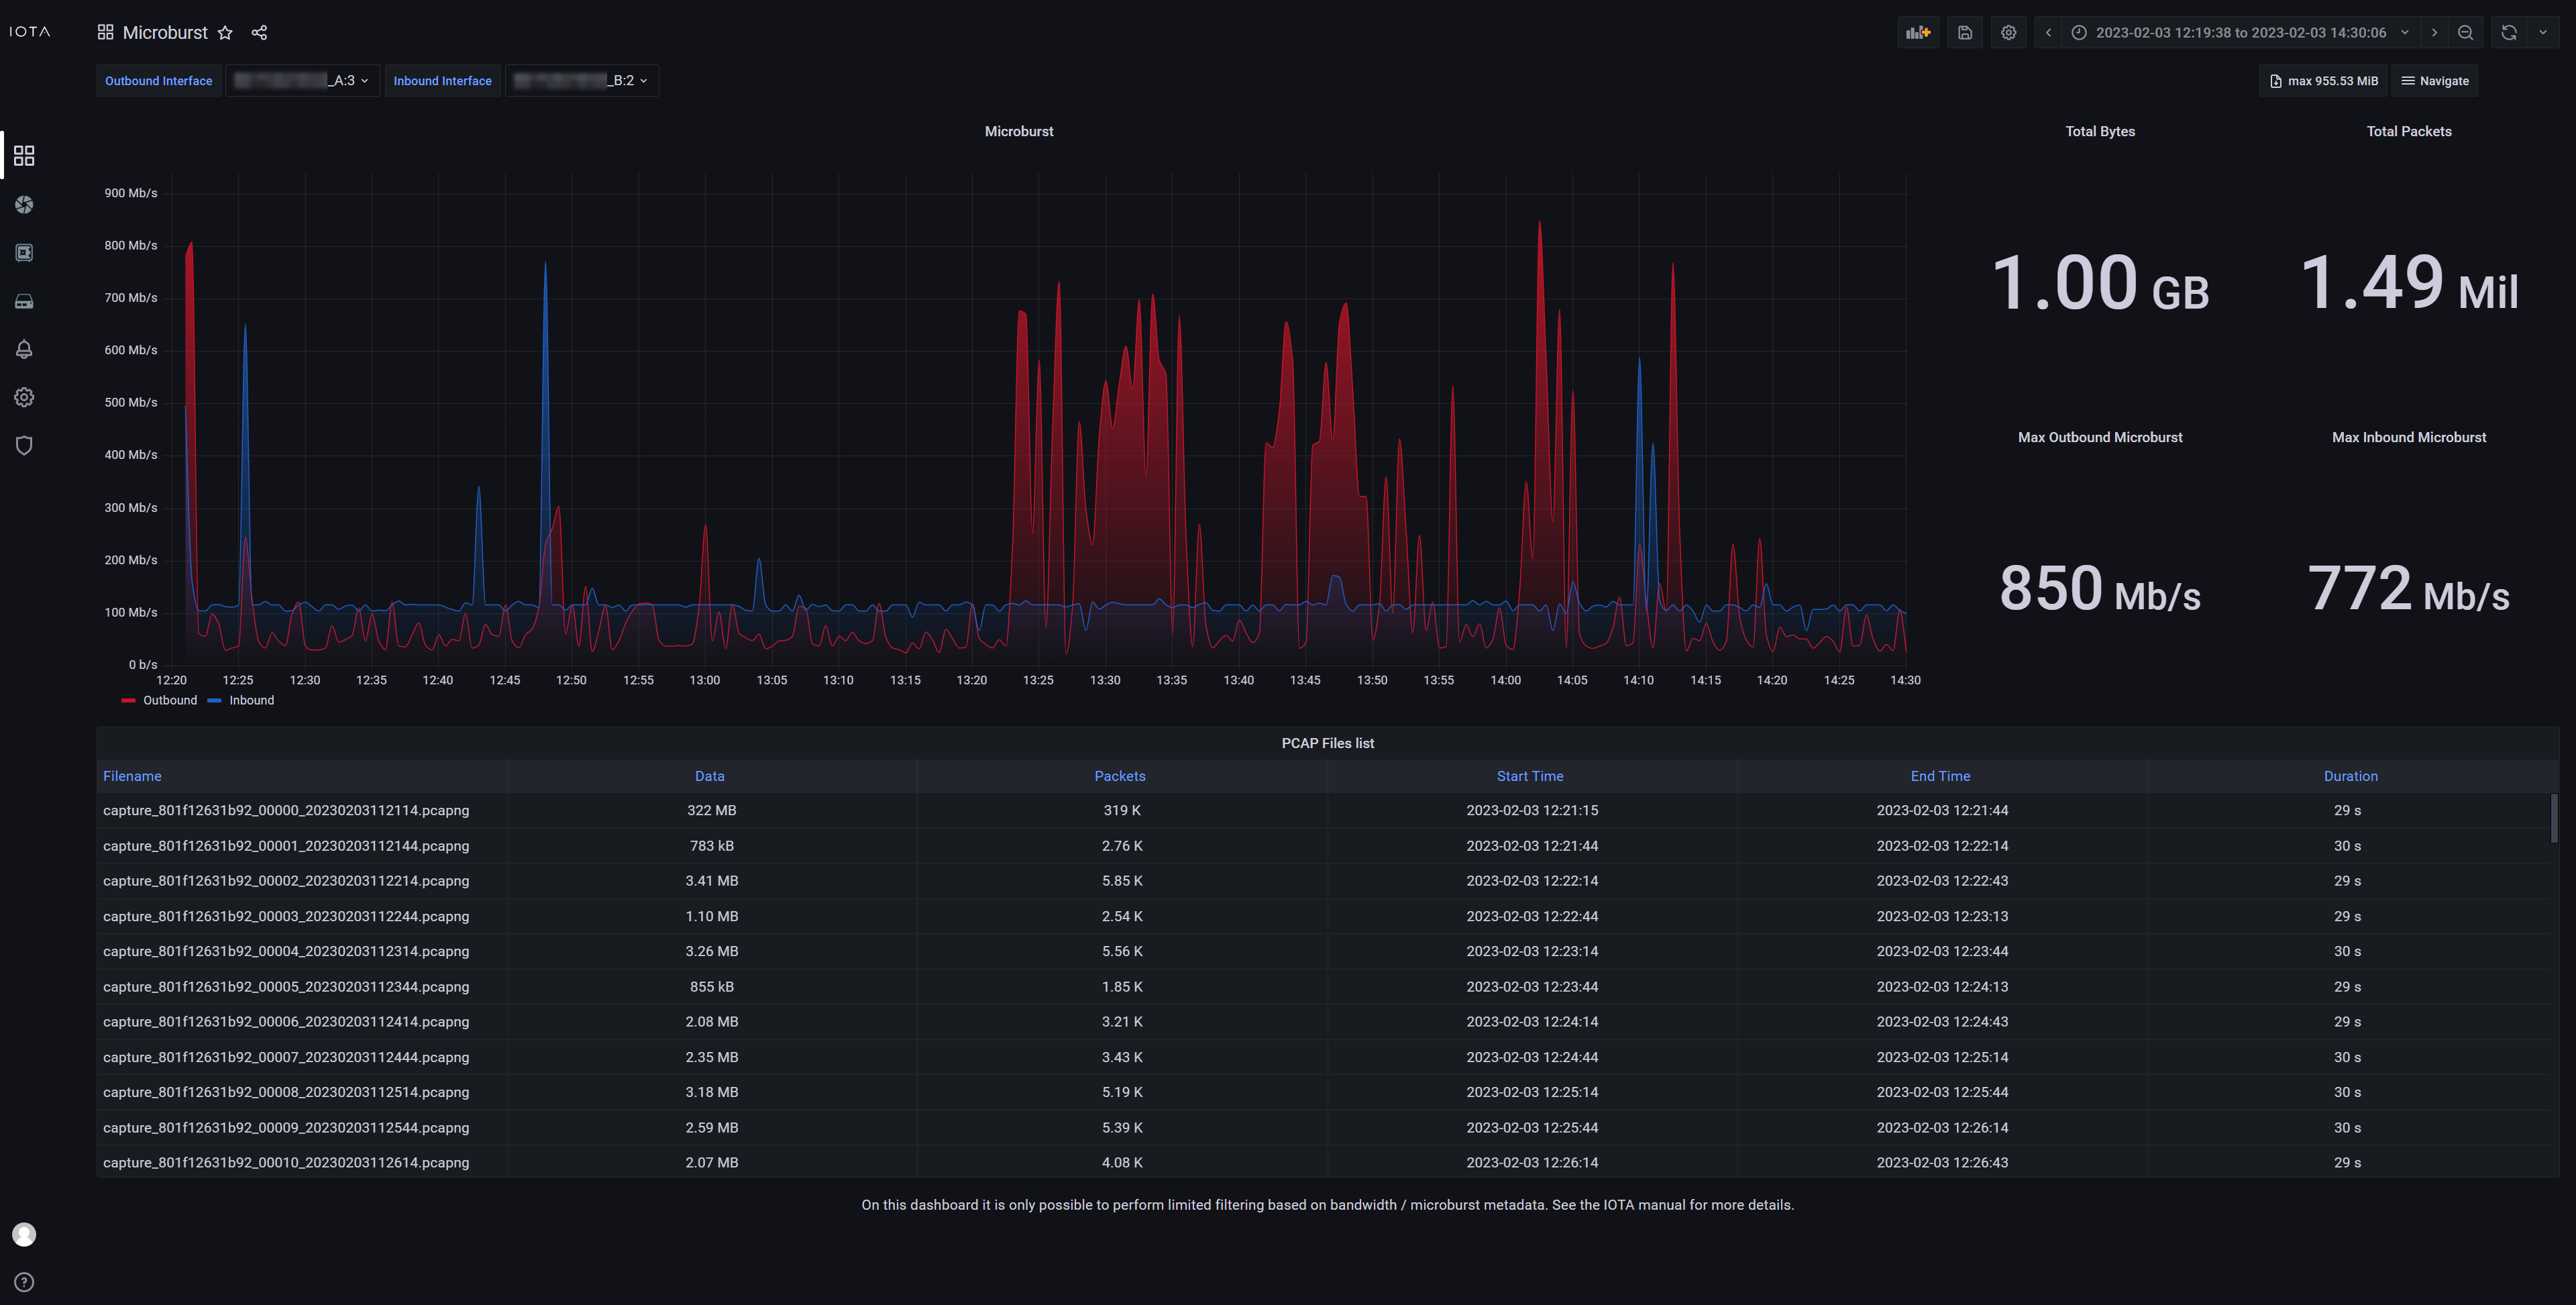
The microburst dashboard provides an overview of traffic microbursts measured on the IOTA interfaces. The dashboard automatically selects the two interfaces as inbound and outbound and displays the microburst data for each of them separately in a chart. This dashboard can be used to get a general overview of microburst events and intensity, and then drill down on the time range where a microburst higher than usual was detected.
The benefit of this dashboard is the ability to detect and filter on intense, short living microburst spikes that may not be visible on dashboards displaying average traffic volume, which helps identify buffer overflow issues. When the user has discovered the impacted time range, they can move to a different dashboard to perform further troubleshooting.
SSL/TLS Overview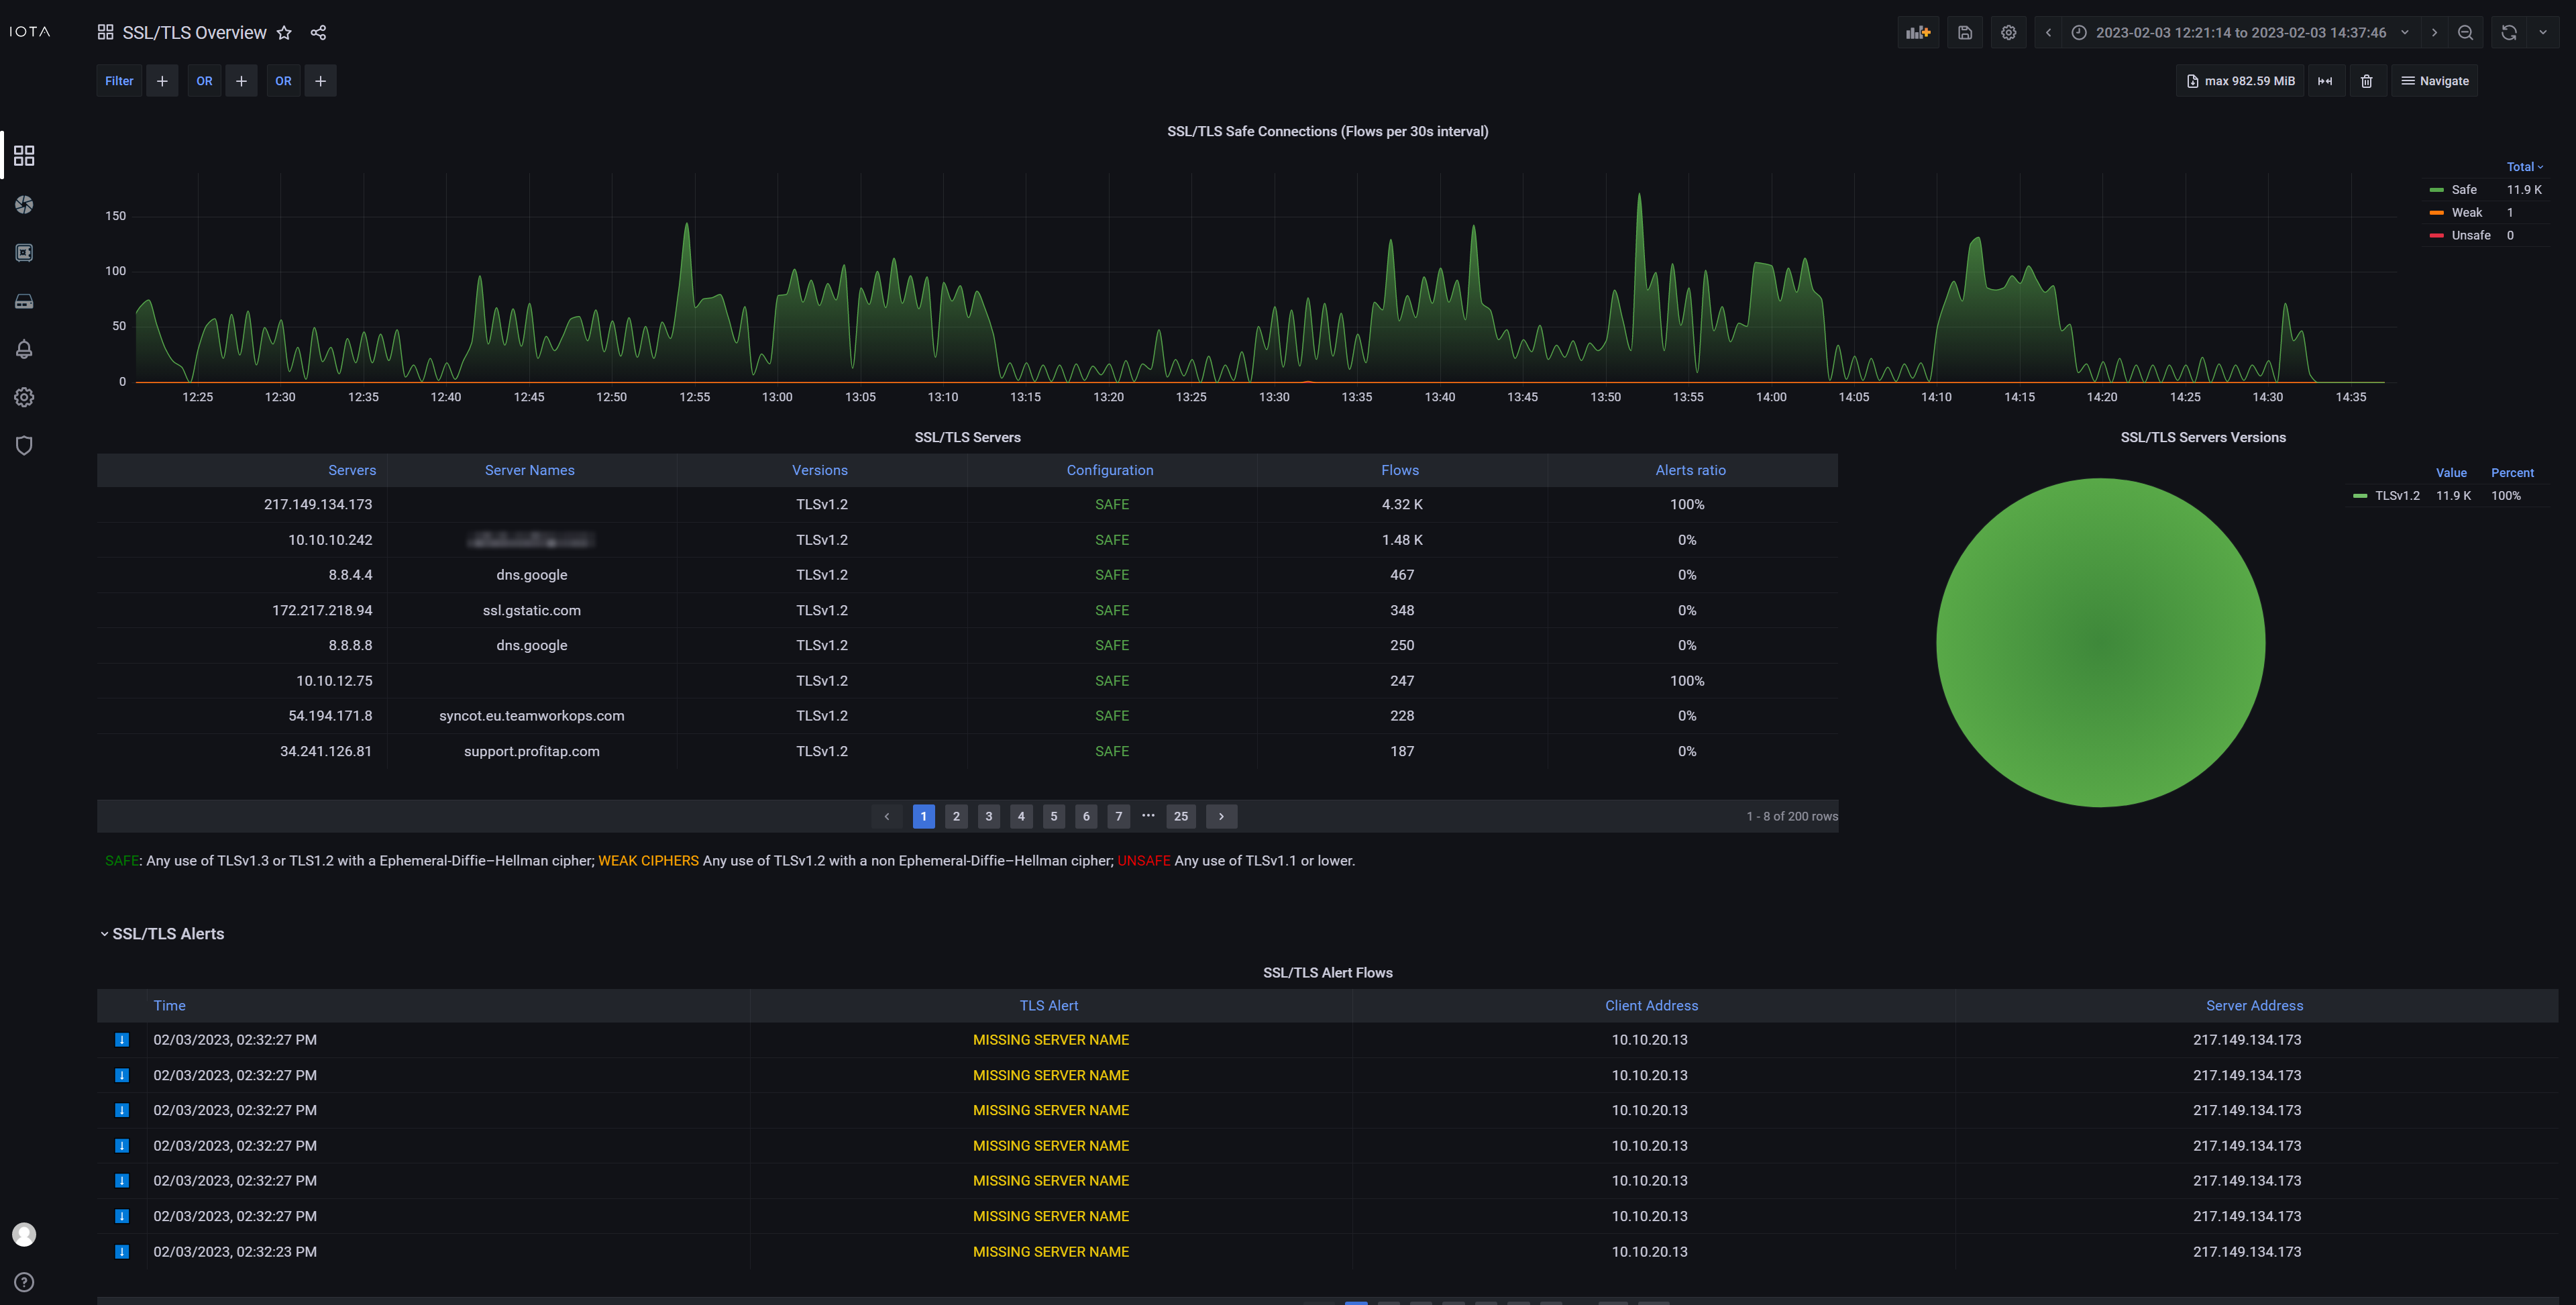
This dashboard provides an overview of TLS-encrypted connections and whether they are considered safe, weak, or unsafe, based on the TLS version and cipher used. Connection information can be sorted and filtered to visualize and identify potentially problematic connections.
TCP Analysis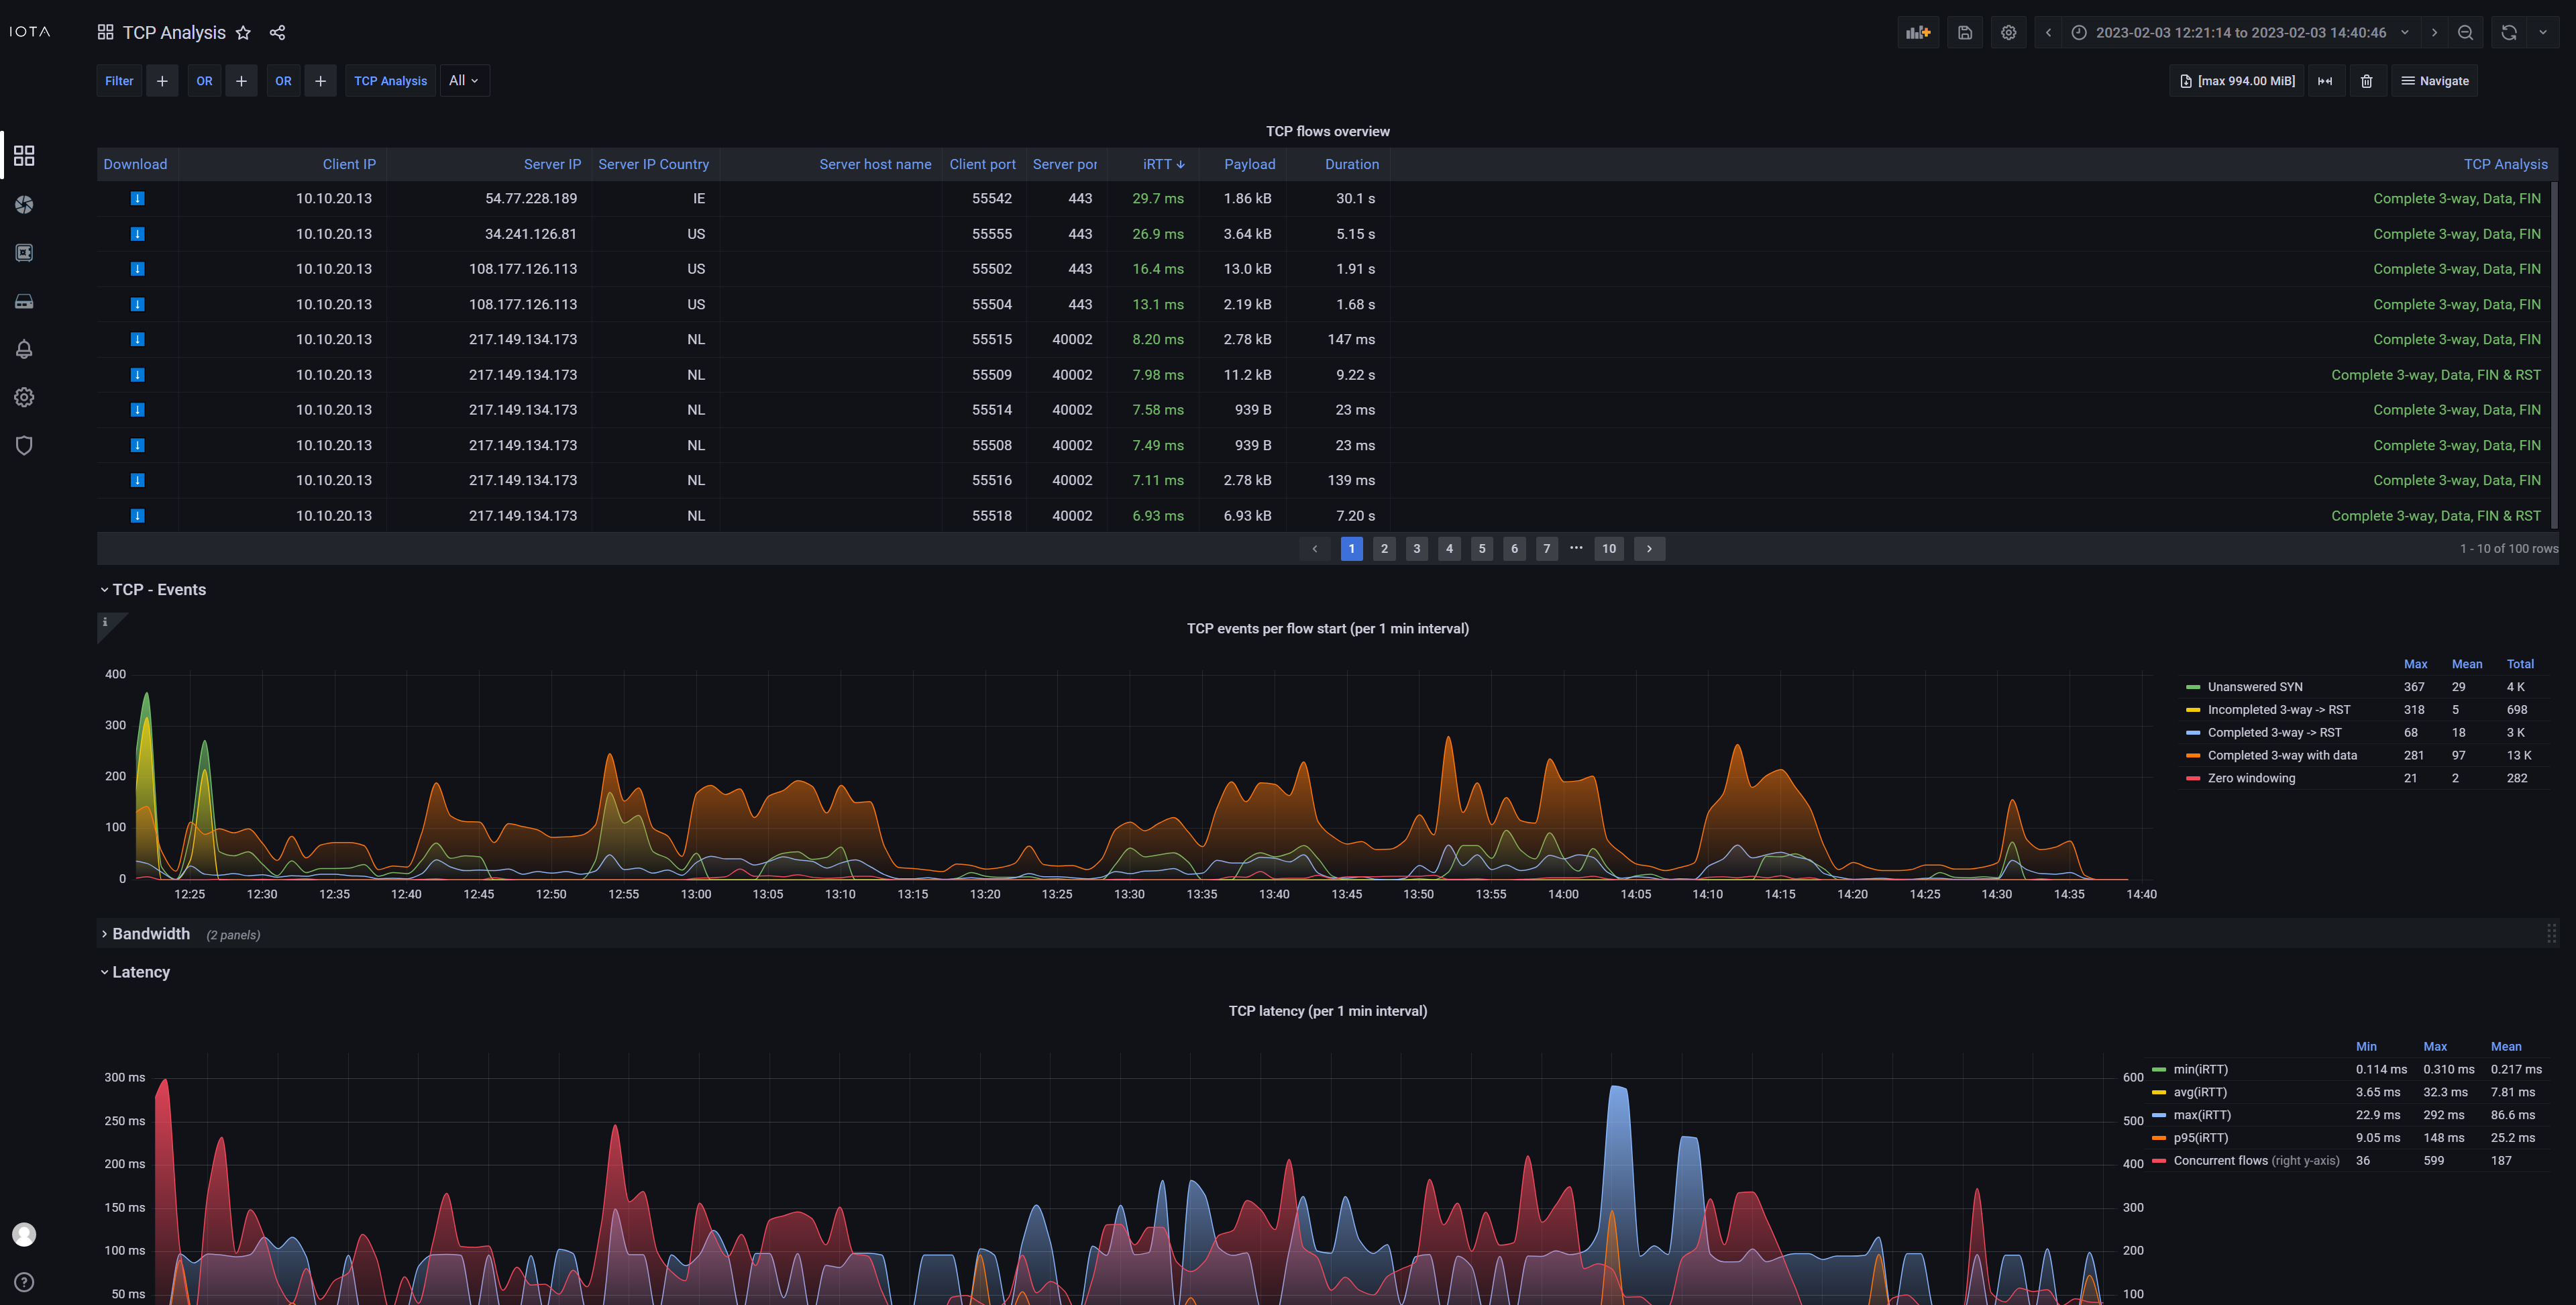
This dashboard gives an overview of TCP-related statistics, such as client IP, server IP, host names, iRTT, and more, such as an analysis of TCP connection completeness. Various graphs are available, providing different perspectives on the TCP traffic and offering full diagnostics of the TCP protocol. You can easily filter on common TCP-related attributes via the filter menu. Color coding of TCP analysis states helps give an at-a-glance view of the data transmission process.
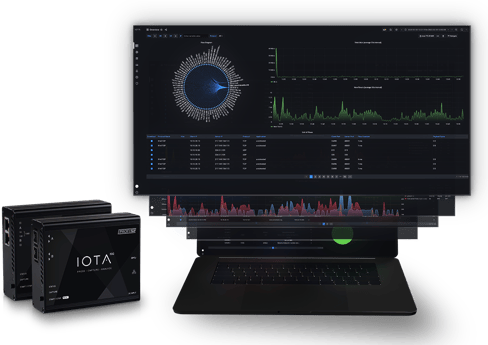
Profitap IOTA brings a complete network analysis and troubleshooting solution for a variety of use cases in small, mid-size enterprises, remote sites, and small data centers. It is a versatile integrated solution, combining TAP, storage, and analysis capabilities in a single portable device.
IOTA integrates its own powerful traffic analysis software, providing the ability to perform flow-based analysis of the PCAP files with various dashboards, like Application Performance Monitoring, Bandwidth Usage, Latency, Top Talkers, TCP Troubleshooting, and more.
Learn more about IOTA by visiting the Profitap IOTA Product Page.