The newly released IOTA software version 2.3.0 includes the following new features:
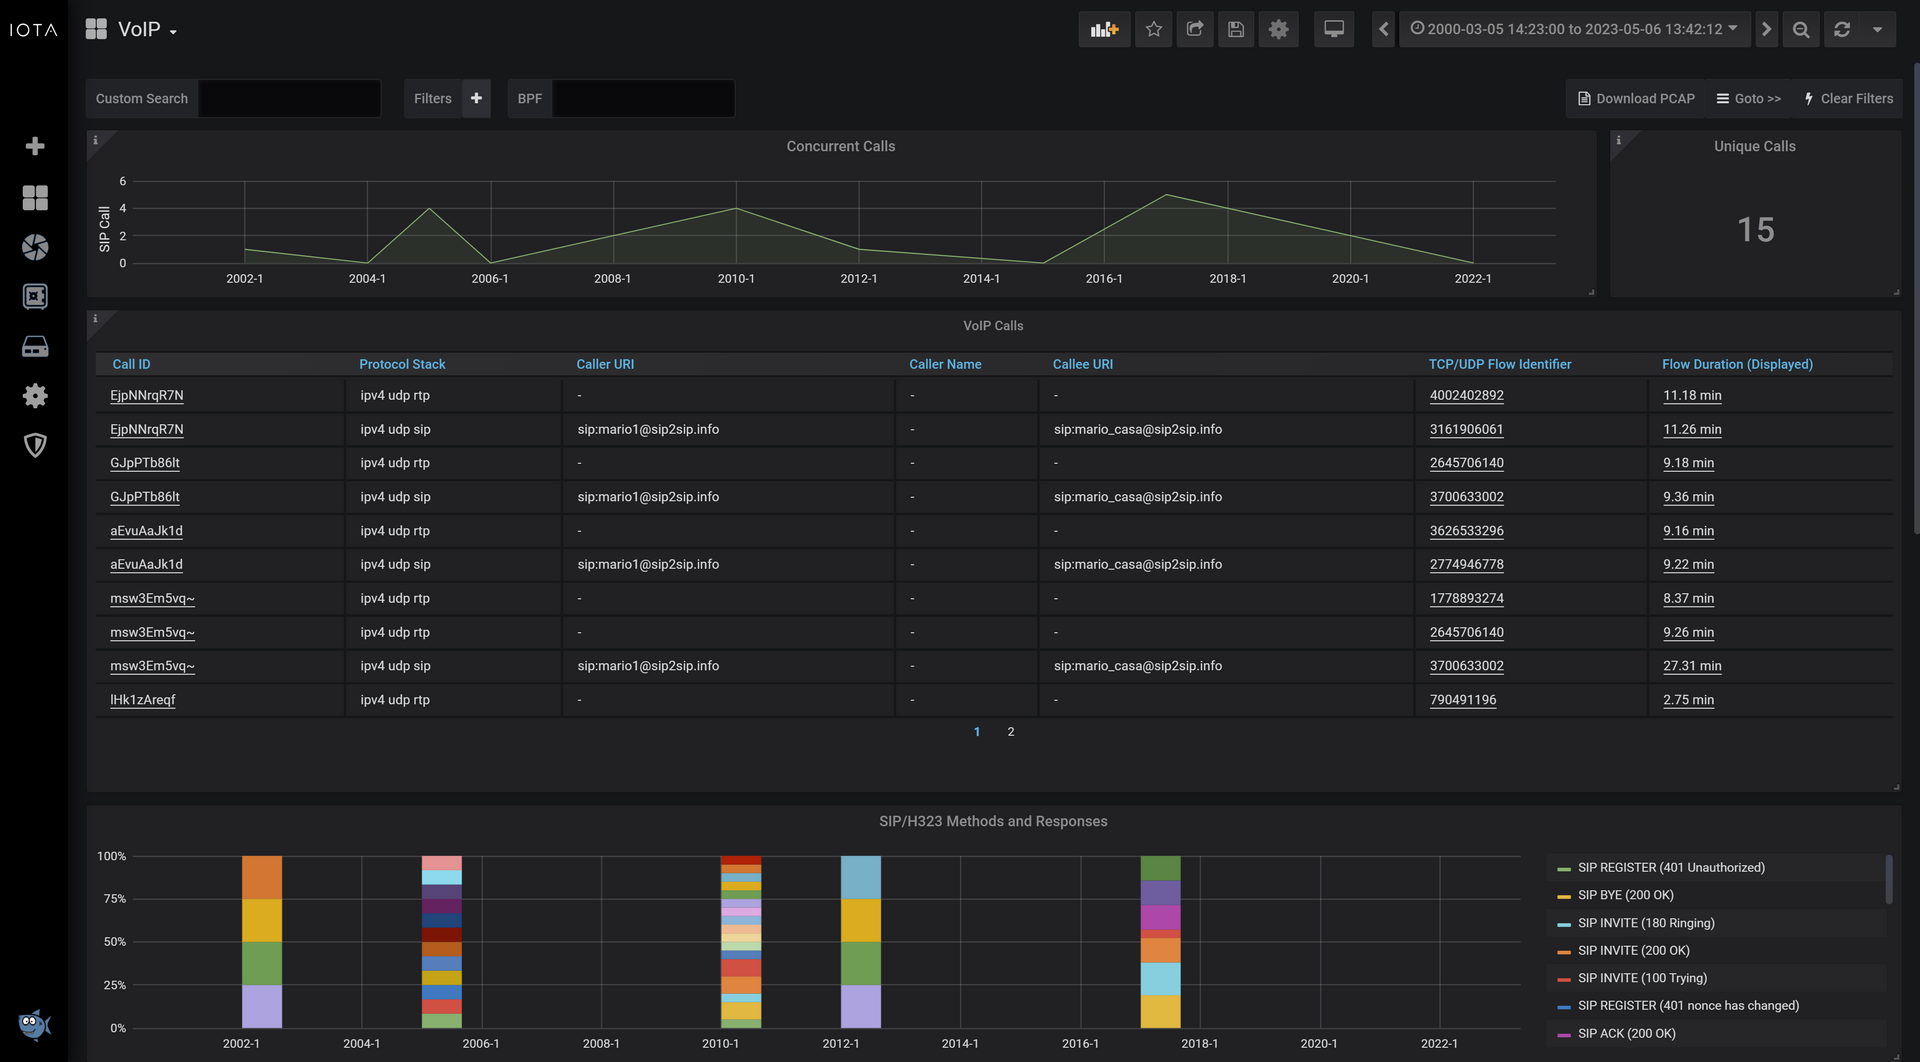
Added VoIP support to traffic flow analysis and visualizations dashboards
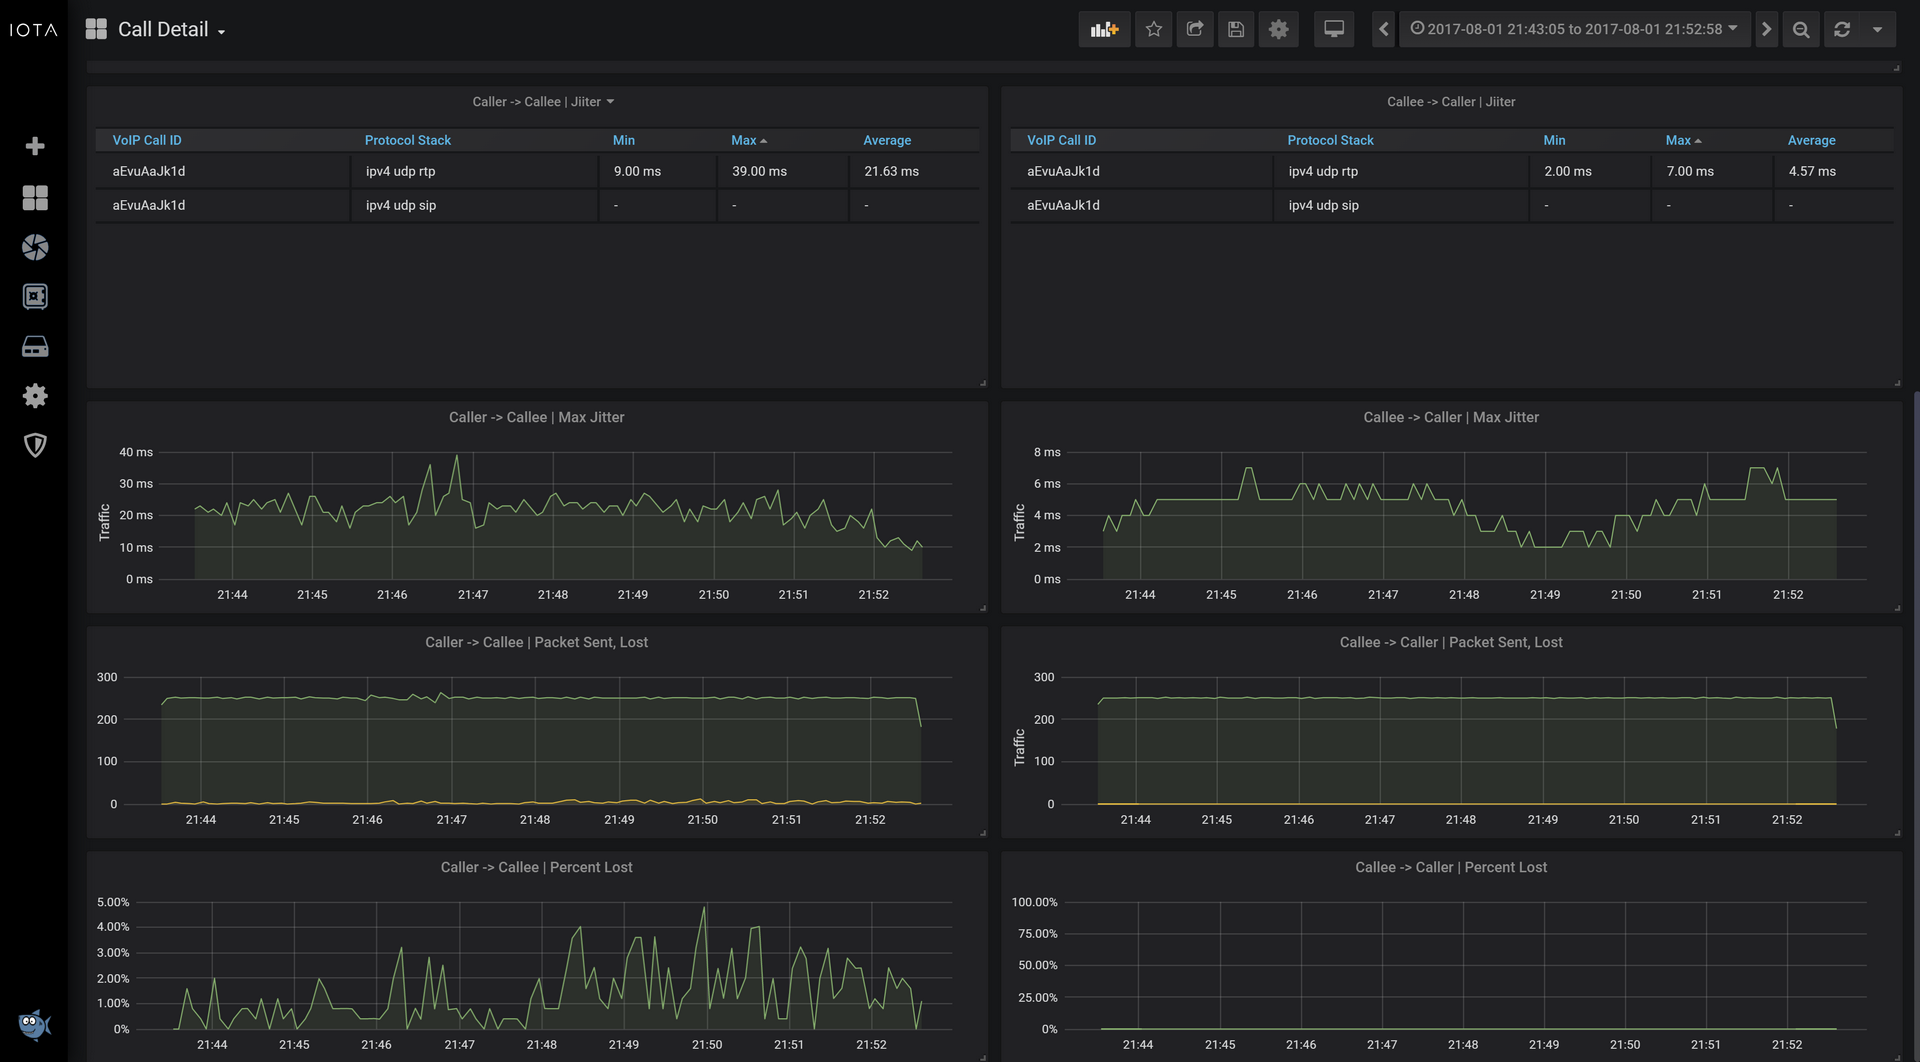
VoIP traffic performance analysis: packets sent and lost, jitter and packets overhead for both communication directions.
Metadata from calls using SIP, H323 and RTP can now be viewed on two new dashboards. The VoIP dashboard shows an overview of call flows.

The Call Detail dashboard displays metrics such as jitter and packet loss. Filters can be used to display these metrics for specific calls.

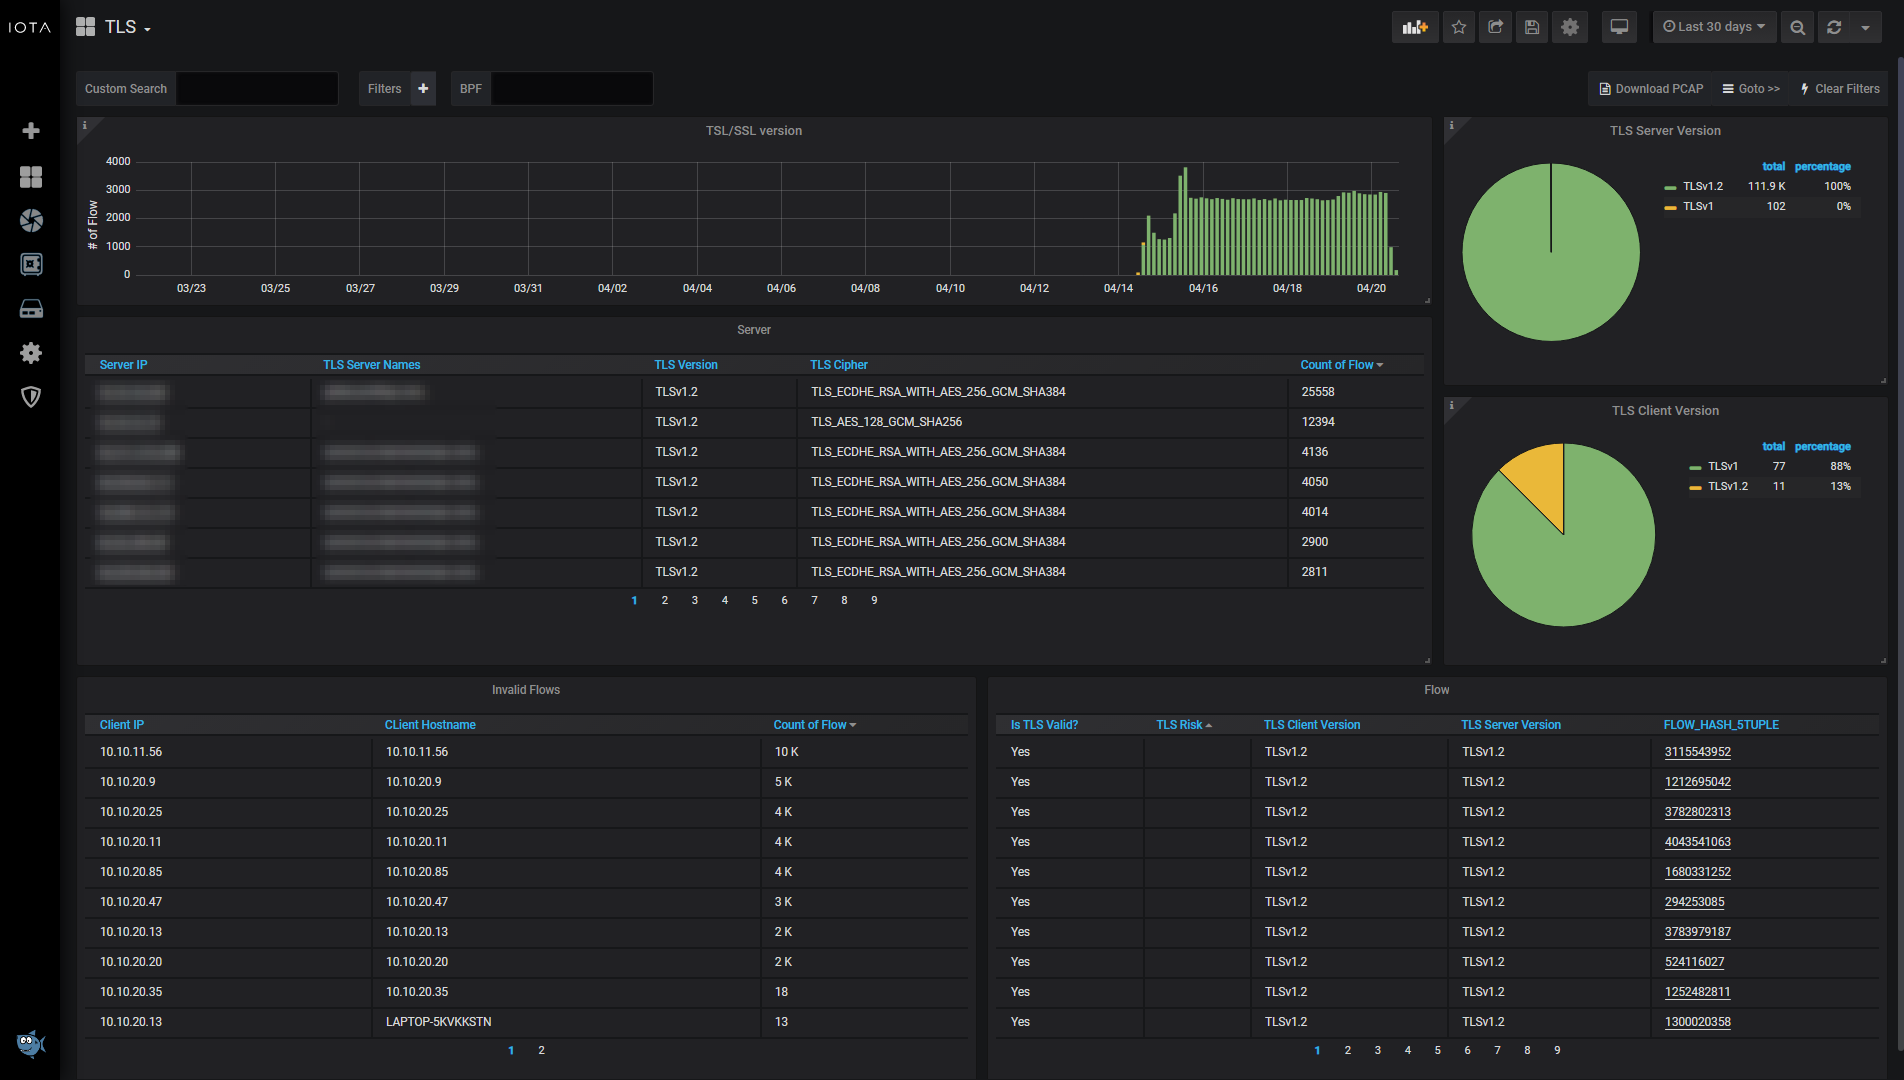
Added TLS support to traffic flow analysis and relative overview dashboard
TLS/SSL analysis: TLS version, certificate validity, server name, cipher type, etc.

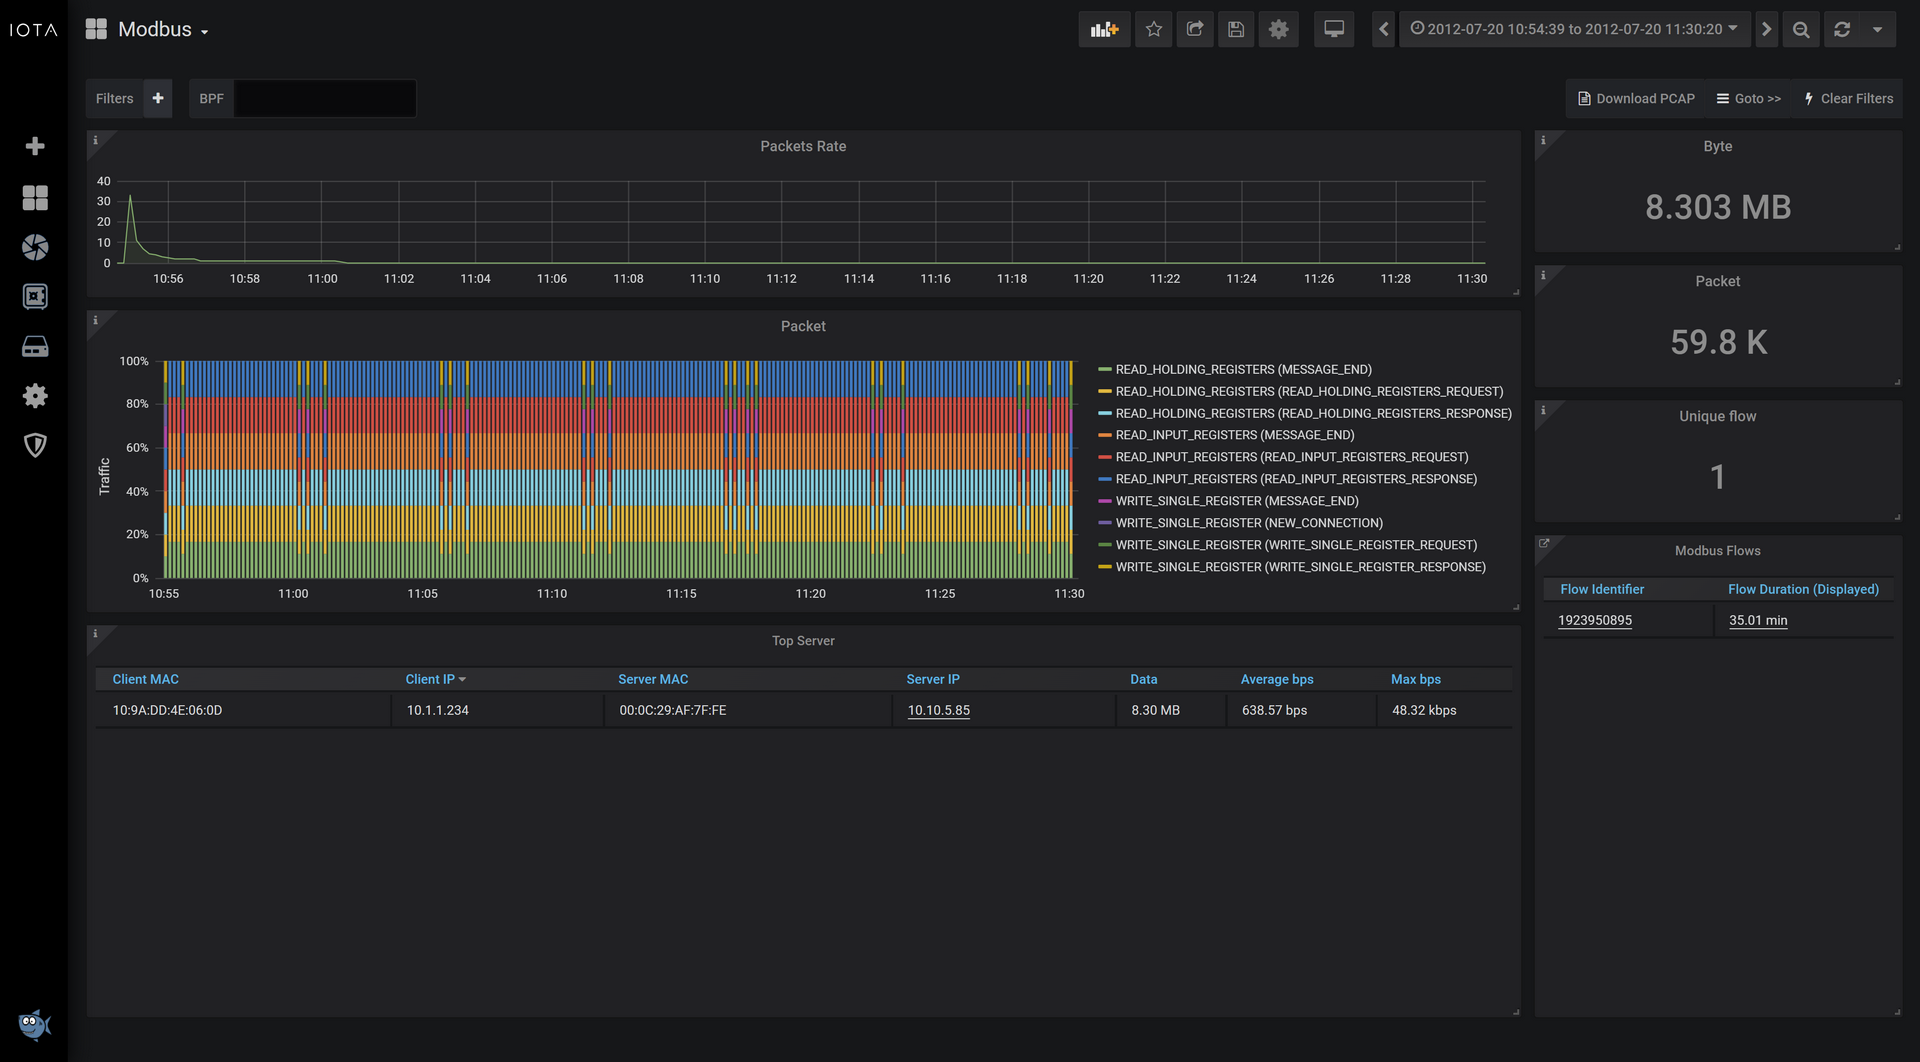
Added Modbus support to traffic flow analysis and dashboard
Metrics related to this industrial protocol can be viewed on the Modbus dashboard.

Various minor improvements and fixes
- Improved reliability of TCP Troubleshoot dashboard;
- Improved usability of Capture Control GUI (tooltips);
- Fixed traffic analysis for capture files from Data Vault.
Profitap IOTA brings a complete network analysis and troubleshooting solution for a variety of use cases in small, mid-size enterprises, remote sites, and small data centers. It is a versatile integrated solution, combining TAP, storage, and analysis capabilities in a single portable device.
IOTA integrates its own powerful traffic analysis software, providing the ability to perform flow-based analysis of the PCAP files with various dashboards, like Application Performance Monitoring, Bandwidth Usage, Latency, Top Talkers, TCP Troubleshooting, and more.
Learn more about IOTA by visiting the Profitap IOTA Product Page.

