In the VoIP environment, it is important to note that there are three data streams, two of which have a noticeable impact on users.
- The first data stream is signaling. Signaling refers to the communication for setup and tear-down, as well as changes. In this process, metadata worthy of protection, such as source and destination numbers, are also transmitted. There are different protocols for signaling, such as SIP (Session Initiation Protocol), H.323, or MGCP (Media Gateway Control Protocol). In the public network and current corporate networks, the SIP protocol is primarily used. However, there are a large number of different SIP implementations. In practice, this leads to a variety of error sources due to incompatibilities. In the signaling payload, or more precisely in the Session Description Protocol (SDP), some parameters such as codecs to be used and the UDP ports, as well as the associated IP addresses for voice data transmission, are also negotiated.
- The second data stream is the transmission of the voice via the Real-time Transport Protocol (RTP). This protocol is based on a UDP transmission and, as a real-time transmission, it is particularly sensitive to latency, jitter, and packet loss. Different codecs with different packetization times, size, and quality can be used here.
- The third data stream is the Real-time Transport Control Protocol (RTCP). It provides statistical data with quality indicators for VoIP. This data stream flows on the same transport path as RTP, but one port number higher.
A major challenge in troubleshooting VoIP environments is differentiating the cause of the error between signaling and voice data or even the underlying network. In many cases, the different media streams must also pass through NAT transitions or security components such as firewalls. In practice, this leads to the teams responsible for VoIP, network, and security shuffling the associated tickets back and forth in the event of errors.
Profitap IOTA has made it its mission to make VoIP analysis effective and efficient. The “blame game” between the different teams is to come to an end through graphically prepared dashboards in combination with diverse filter options for SIP and RTP and to shorten the mean time to recover (MTTR) for the end user through quick error analysis. Service providers can thus also better meet their SLAs.
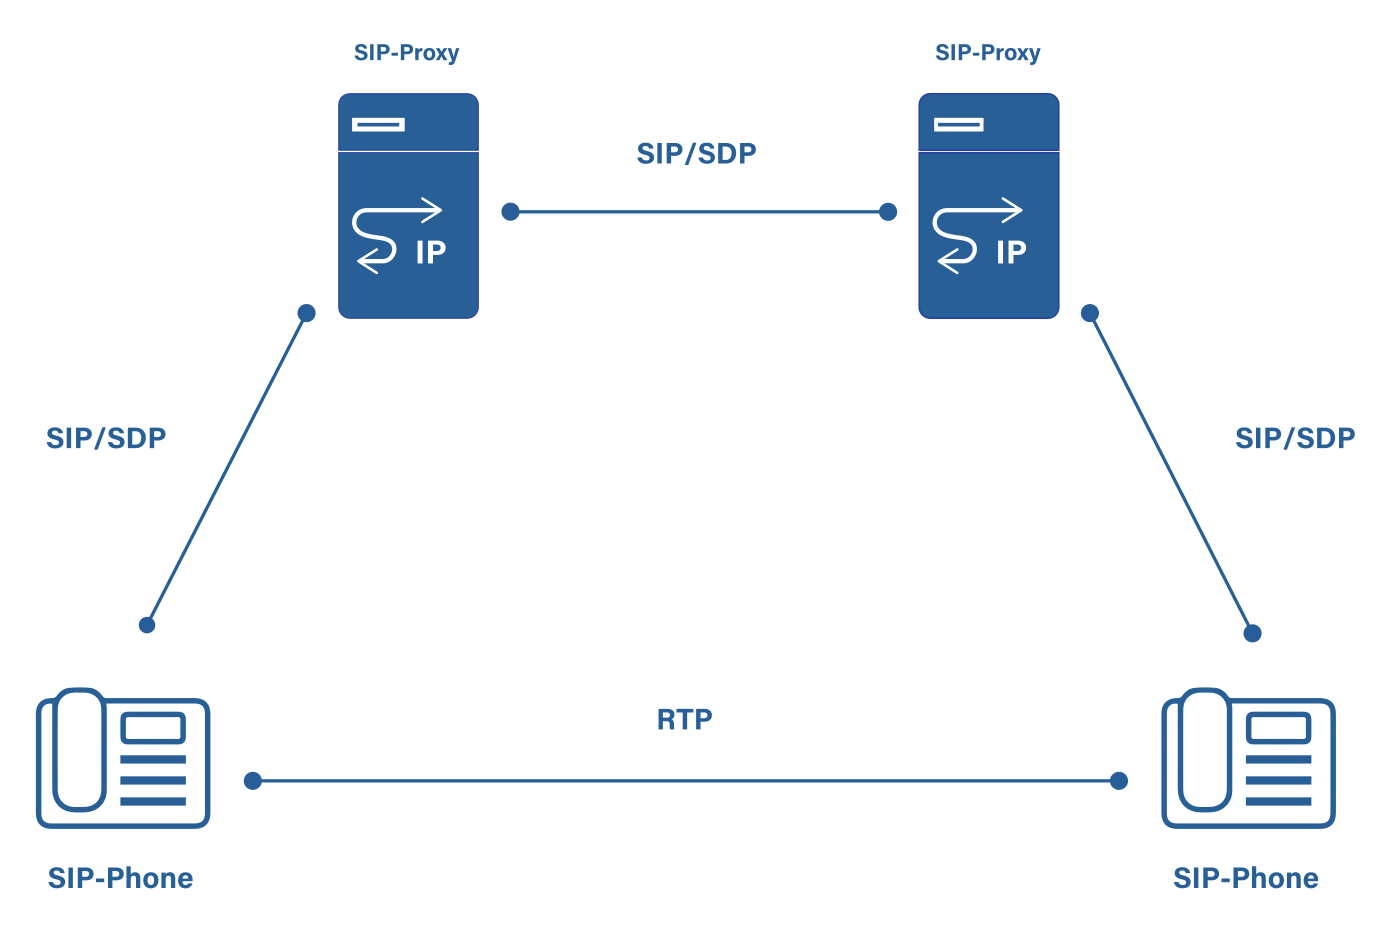
Figure 1: SIP trapezoid with differentiation between signaling over SIP and voice over RTP.
Root Cause Analysis in VoIP networks
Root cause analysis in VoIP networks is often like looking for a needle in a haystack. Users usually come up with rather unstructured error messages, such as “My phone stopped working yesterday. I always get a busy signal” or “I have intermittent communication problems in the middle of a call”. Whether this is due to the network, a firewall, a signaling error on a SIP proxy, or an error in the end devices is difficult to differentiate at first. One-way or no communication at all (one-way audio or dead air effect) and intermittent dropped calls are also a challenge in the troubleshooting process. It is therefore important to determine the root cause of the problem.
If the Key Performance Indicators packet loss, jitter, and delay are bidirectional without any abnormalities, a security and network problem can be ruled out. The cause can then be sought directly in the VoIP environment. However, not every VoIP connection can be directly measured end-to-end. So-called session border controllers (SBC) can terminate and manipulate the SIP dialog and the RTP data stream for each communication side at security transitions. It can therefore happen that, despite measured packet losses of 0% to the provider behind its SBC, there is a packet loss to another provider. This means that VoIP analyses often have to be performed at multiple points in the network.
In the VoIP environment itself, it must first be defined whether the problem is in the signaling or in the voice data stream. If problems occur when a connection is established/terminated or during a change such as a call hold or a codec change, this is due to a signaling problem, and filters can be used to isolate the problem in the SIP data.
More challenging to analyze are error patterns such as dead air and one-way audio. These can come from the network, but also from firewalls and IPS systems or problems in modules of the VoIP system. An example of a network error would be faulty routing or NAT transition. The problem with NAT in the context of VoIP is that only the IP information is replaced in the header but not in the payload. However, SIP transmits IP and port information for the RTP stream in the Session Description Protocol (SDP). Now, if a NAT transition manipulates the IP headers but no adjustment is made in the payload, this will result in one-way or no communication because the RTP stream will be routed to the wrong destination.
At the same time, there is also the possibility that a firewall allows the ports for signaling but blocks the RTP data stream. But intrusion prevention systems also offer a possible source of error for blocked RTP data streams. At the same time, however, in the VoIP environment, this could also be due to only one-sided encryption with SRTP or a faulty codec switch, or defective VoIP modules, such as DSPs. For root cause analysis, therefore, a tool is needed that can be used flexibly at different points in the network and enables a “drill down” to the required information with simple means.
How can Profitap IOTA help?
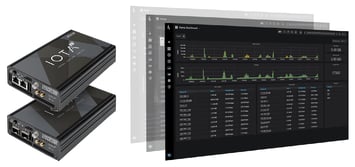
Profitap IOTA offers a portable solution for VoIP analysis. This makes it suitable for recording and analyzing at different points in the network.
Both inline and SPAN mode operation are possible, making it a flexible tool for VoIP analysis, as it can be connected between telephone and switch in inline mode, but also directly at a SPAN port of the switch. For example, when entire VLANs or a switch port to a session border controller or an IP PBX must be analyzed.
In addition to pure recording, however, the IOTA also offers application-side analysis functions for VoIP. This means that finger pointing between network and voice teams can be quickly put to an end. Network administrators can detect packet loss and jitter for defined time periods or even a specific call. This can be done by filtering on the source or destination URI of the caller.
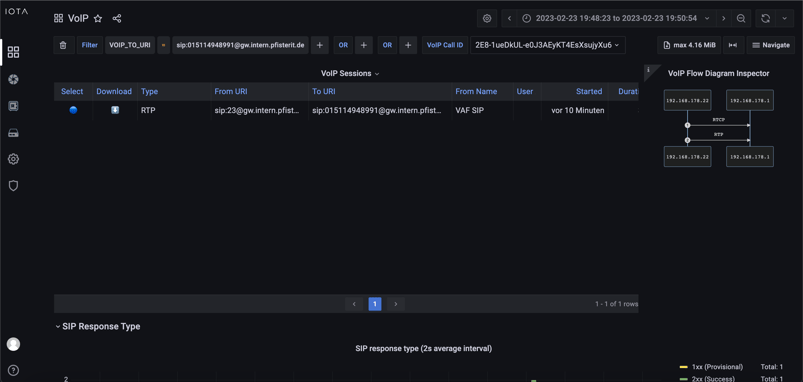
Figure 2 provides an example of a filter on the destination URI. If the VoIP administrator even passes the call ID of the call, filtering on the call can take place directly. In this way, the error can be pre-qualified to the extent that it is possible to search for link errors and quality of service problems on individual network components such as switches and routers.
For quality problems in the transmission of voice data in the RTP data stream, IOTA offers a variety of options. For example, there is a prepared call detail dashboard that shows the jitter and packet losses separately for the calling party and the called party. The display of packet loss shows the values both as a percentage of the total number of packets and in the pure amount of packets that were lost. In addition to the clear graphics, filters with “>=” are also available. This way, calls with packet losses and jitter above certain thresholds, such as jitter >= 20ms, can be filtered out.
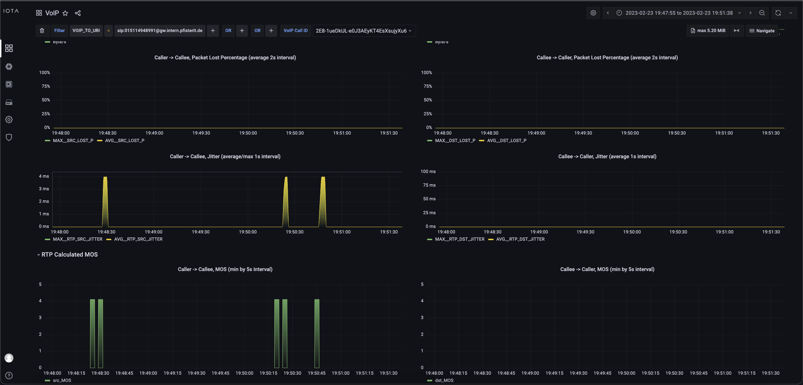
Figure 3: RTP quality parameters jitter and packet loss in graphs. Packet loss is shown as a percentage as well as in the number of packets.
The click-and-drag feature in the graphic interface offers the possibility to jump specifically into a time range in case of detected abnormalities. A simple click-and-drag is sufficient to limit the time range. If the network analyst detects a high percentage of packet loss compared to transmitted packets in the Call Detail Dashboard, he can identify the call IDs and use them in filters to identify problematic communication relationships. For example, if the analysis of a dead air effect repeatedly leads to a specific port range, a missing or insufficient firewall clearance could be the cause.
This offers the possibility to quickly pre-qualify tickets for communication problems in the VoIP environment. The IOTA makes it possible to narrow down the error more and more closely by means of various filter options in order to arrive at the “root cause” of the problem.
The IOTA also offers a lot in the area of signaling errors. To be able to recognize patterns of signaling errors, the graphic “SIP Methods and Responses” from the VoIP Dashboard shown in Figure 4 is useful. If “488 Not acceptable here” were increasingly visible, this would indicate an incompatibility of the codecs, for example. In case of “403” error codes, on the other hand, the SIP proxy rejects the request. In the case of increased “404 Not found” messages, one can specifically take a look at the Callee URIs in the VoIP Dashboard to identify the erroneous destination numbers or destination domains. In the example in Figure 4, some 403 responses are visible. These are due to the SIP authentication used and are therefore perfectly fine.
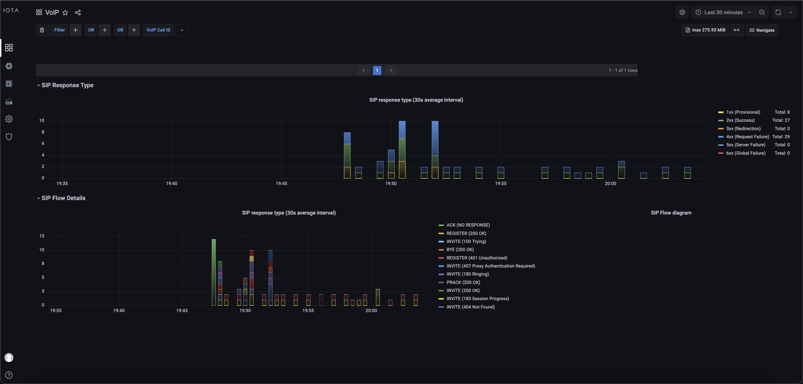
Figure 4: Graphical representation of the total SIP request methods and associated responses.
In the case of a delayed call setup, the latency data of the signaling could also provide some insight. For SIP over TCP, the round-trip time offers a first starting point. IOTA can also analyze this.
For more complex cases, PCAP data can also be downloaded specifically for closer analysis in Wireshark. For example, with unencrypted RTP and a supported codec, the recorded audio content can be listened to in the RTP player to get an impression of the voice quality independently of the phone. Even an automated export of PCAP files to an external data source is possible.

