Granular network visibility is more than a luxury; it’s a mission-critical requirement. Profitap’s advanced network traffic capture and analysis solution, the IOTA 100 Core, redefines what’s possible in this field by offering a KPI-centered architecture that gives engineers real-time, actionable insights.
Below, we examine the key performance indicators (KPIs) for network monitoring that the IOTA 100 Core extracts, how its architecture supports accurate and continuous data capture, and what this means for network diagnostics, planning, and security.
The KPI insights provided by the IOTA 100 core
Here are the principal KPI categories that the IOTA 100 Core continuously extracts and makes available through its analysis interface:
1. Network Health KPIs
- Packet loss rate: Measures the estimated percentage of packets lost during transmission, based on TCP retransmissions. Although this does not exactly match actual packet loss, it offers a dependable proxy for identifying reduced link quality, network congestion, or hardware failures within TCP traffic.
- Retransmissions and duplicate packets: This tracker tracks the rate of TCP packet retransmissions and the detection of duplicate packets. Elevated retransmission counts signal congestion, jitter, or aggressive error recovery in transport layers, which is key for pinpointing instability or throughput degradation sources.
- Latency and jitter: Provides round-trip time (RTT) and variance in packet delivery intervals. These metrics are essential for latency-sensitive environments, especially for VoIP, video conferencing, and real-time industrial applications, where even slight fluctuations can disrupt service quality.
2. Utilization and Throughput KPIs
- Interface throughput (bps/pps): Provides both bits per second (bps) and packets per second (pps) measurements at full line rate. Real-time throughput analysis reveals bandwidth saturation points, DoS scenarios, or underutilized links, supporting accurate capacity planning and peak time optimization.
- Top talkers and conversations: This tool maps traffic distribution by identifying top bandwidth consumers and scrutinizing high-volume conversations. This contextual visibility supports threat hunting, abuse detection, and optimization of overtaxed network segments.
- Application usage breakdown: This process dissects network traffic by application or service type, revealing which business processes or unauthorized tools are consuming bandwidth. This information is vital for QoS enforcement, compliance audits, and controlling shadow IT.
3. Performance KPIs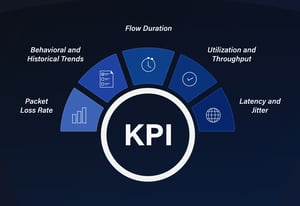
- DNS and HTTP response times: This measure quantifies the responsiveness of foundational services by measuring resolution and transaction latency. Slowdowns here can cascade into widespread application performance issues.
- TCP Application performance: Tracks handshake latency, round-trip delays, and session setup efficiency for TCP-based applications. Early detection of anomalous handshake signals can reveal deeper issues at either the host or network layer.
- Flow duration: Measures how long communication sessions persist, providing insight into typical session behaviors, potential resource leaks, or persistent malicious connections.
4. Behavioral & historical trends
- Long-term traffic growth and saturation analysis: Provides visibility into gradual changes in utilization levels, helping to forecast when network segments or devices will require upgrades. Identifying consistent upward trends in throughput or session counts prevents surprises in capacity and ensures budget planning aligns with infrastructure needs.
- User and device behavior profiling: Monitors key endpoints' recurring communication habits, including login times, preferred services, and peer interactions. Over time, deviations in endpoint behavior, like a sudden increase in data exfiltration attempts or access to atypical resources, are quickly recognized and escalated.
- Trend correlations across KPIs: Historical datasets can be cross-referenced, for example, correlating rising retransmission rates with long-term increases in utilization, or mapping jitter spikes against specific application rollouts. This contextual linkage accelerates root cause analysis and ensures that recurring issues are addressed systematically rather than reactively.
- Forensic replay of historical traffic: Enables security and operations teams to rewind and analyze prior traffic conditions, reconstructing the exact circumstances leading up to an incident. This provides critical insights for incident response, compliance reporting, and post-mortem investigations.
Visual dashboards: from data to decisions
All KPIs are rendered in intuitive, real-time dashboards integrated within the IOTA interface. Engineers can pivot from macro trends to micro insights in seconds with:
- Correlation tools to link anomalies across layers (L2-L7)
- Timeline analysis for forensic replay or root cause investigation
-1.png?width=700&height=355&name=image%20(9)-1.png) Whether used for live troubleshooting or historical analysis, the dashboards bridge the gap between data and decision-making.
Whether used for live troubleshooting or historical analysis, the dashboards bridge the gap between data and decision-making.
Final thoughts: why KPIs matter
These KPIs are especially useful for long-term planning, compliance checks, and forensic analysis. They also help with SLA validation, troubleshooting performance issues, and proactive optimization. In a modern IT environment where latency, downtime, and cyber risks have direct financial impacts, the IOTA 100 Core stands out by providing real-time, KPI-driven insights that engineers can rely on. It is not just a passive recorder but an intelligent, adaptable system for proactive network management. From identifying the source of slow applications to detecting unusual traffic spikes, the IOTA 100 Core enables you to see clearly, respond quickly, and plan wisely.
| IOTA EDGE (1G / 10G) | IOTA CORE (10G / 100G) | IOTA CM |
 |
 |
 |
|
|
|

|

|

|