
(This is an example from our website as illustration, actual workflow below)
Problem description
Short-term overloads in the network, so-called microbursts, can affect the Quality of Service of applications. These are difficult or impossible to detect with conventional methods, such as interface statistics on switches and routers, but also SNMP data. This is because these methods typically only evaluate long time intervals. The analysis of microbursts thus presents IT managers with a real challenge in troubleshooting.
Getting started
The following example gives a step-by-step overview of how microburst analysis can be done using Profitap IOTA.
In the first step, we need to configure the physical interface. To do this, we navigate to the Capture menu in the left menu tree and then to the Interface Configuration section. In the configuration shown, the interface is configured in in-line mode with 10/100/1000 Mbit/s Auto-Negotiation, which means the physical interfaces can see and capture the traffic to be analyzed directly from the in-line link. If the IOTA is to be set up for out-of-band capture, to receive traffic from a TAP or SPAN port, the Inline Mode box must be unticked, and the Save button clicked.
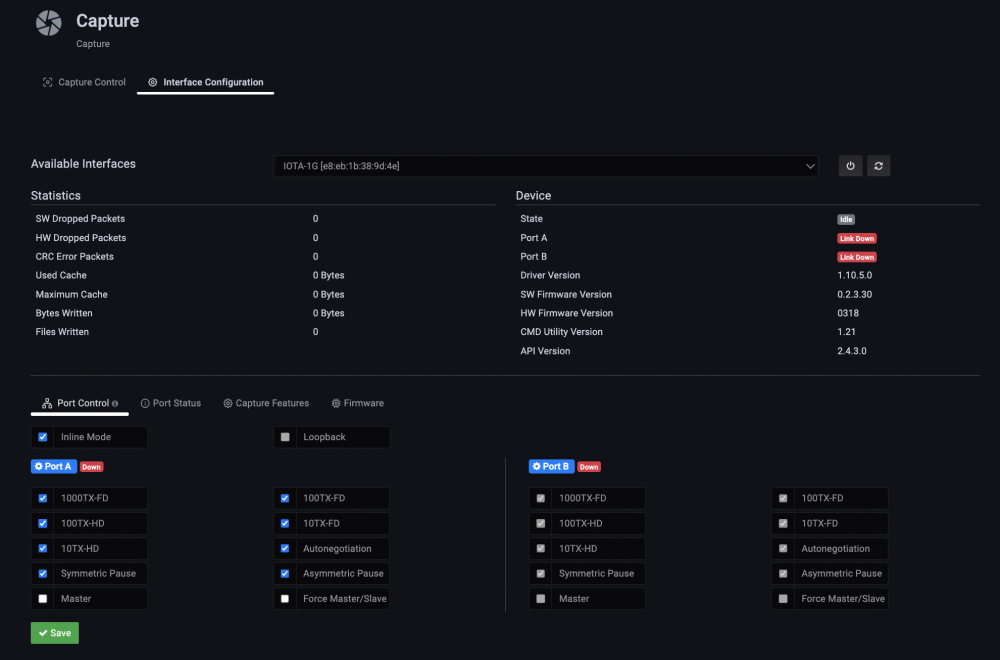
Figure 1: Configuration of the physical interfaces. In this case, 10/100/1000 Mbit/s Auto-Negotiation in In-line Mode.
Placement of the IOTA
For microburst error pattern analysis, the IOTA should be deployed in-line, either with the integrated ports of the IOTA or through the use of a TAP.
To obtain a realistic scenario, the IOTA should be placed as close as possible to the point where the error occurs. However, if a bottleneck occurs with a large number of clients, it is first necessary to determine which components and interfaces they use to communicate to determine the appropriate point. This is often the WAN transition to the provider.
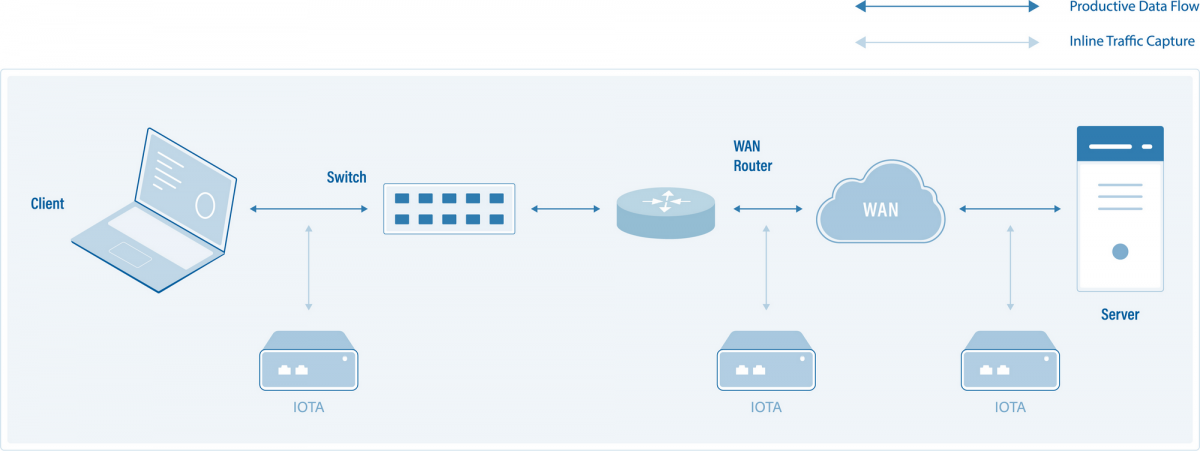
Figure 2: Placement of the IOTA for packet averaging and subsequent analysis of microbursts.
Starting the capture
After placing the IOTA and preparing the physical interface, we connect to the appropriate cable, then start the capture process by navigating to the Capture Control section and clicking the Start Capture button at the bottom of the screen.
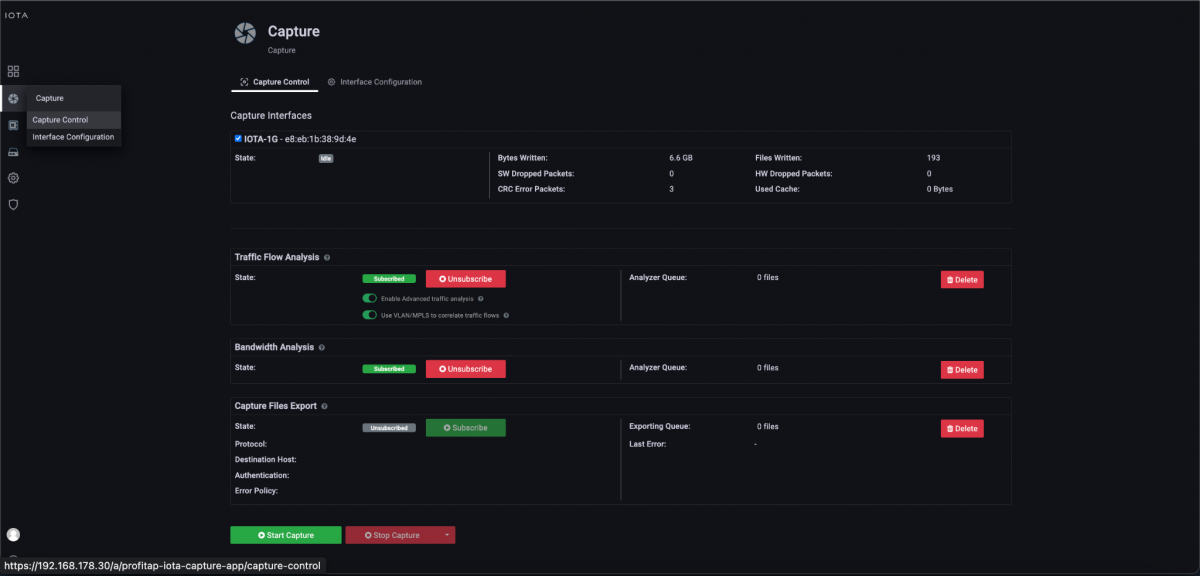
Figure 3: Start the capture using the “Start Capture” button in the “Capture Control” section.
Microburst analysis 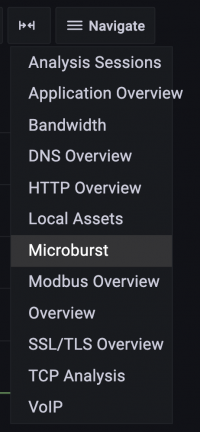
When the user reports a performance problem, we first ask them the time of occurrence. This is usually only very rough: in our example on 20.05.2023, between 18:50 and 19:00. In the follow-up, we first restrict the time interval to this range. For this, we use relative or absolute specifications of the time range, or a “drill-down”. Then, we switch to the Microburst dashboard using the Navigate menu.
Figure 4: Switch to the Microburst dashboard using the Navigate menu at the top right-hand corner of the screen.
On this dashboard, there is a drill-down in the range of loads to narrow the time range.
The Microburst dashboard displays microbursts based on very short time intervals, as shown in Figure 5. IOTA automatically selects the appropriate interfaces and displays the maximum inbound and outbound microbursts in megabits per second in the lower right pane, and the number of bytes and packets transmitted in the time interval above that. Outgoing traffic is shown in red and incoming traffic is blue in the chart.
After our drill-down to the corresponding time range, we get a display of microbursts in 200 milliseconds time intervals. We detect a utilization of 998 Mbit/s on a 1 Gbit/s connection, corresponding to a full load. This bottleneck caused performance problems.
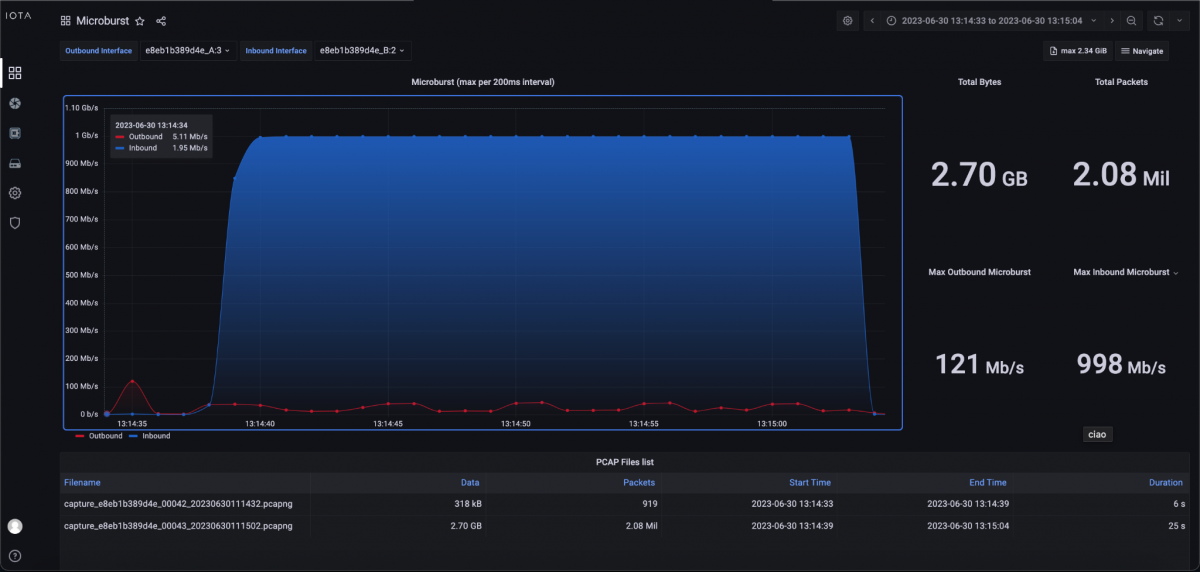
Figure 5: Microburst dashboard after drill-down with 200ms time intervals.
However, we still need to analyze which flow the network “slowed down” the application. To do this, we need to switch to the Application Overview dashboard via the Navigate menu.
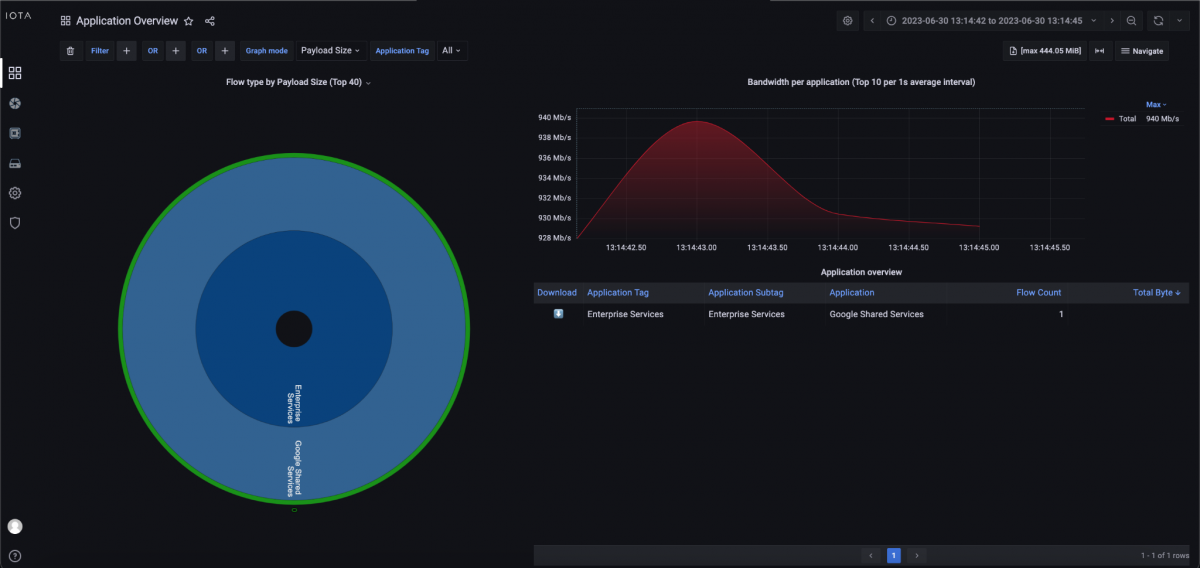
Figure 6: Application Overview dashboard which points to the application that is the root cause of the inspected microburst.
On the Application Overview dashboard, we can see applications recognized by IOTA. IOTA uses deep packet inspection to recognize used applications. As we can see in Figure 6, traffic to Google Shared Services led to the microburst. So we went back to the client, where the problem started, and looked at which Google services were used at the moment. We saw that a Backup to Google Drive was running at this time, consuming the entire link capacity.
If the Application Overview dashboard does not recognize the application, IOTA has the option to export the corresponding time frame in the Microburst dashboard. We can go back to this dashboard and click the Download button to the left of the Navigate menu, so we can analyze the PCAP in other tools like Wireshark if needed.

Figure 7: Direct download of data at the appropriate time interval from the Microburst dashboard.
At the bottom of the Microburst dashboard, we can also see corresponding PCAP files with time ranges, duration, and file sizes. We can copy these filenames to download the ones we need.

Figure 8: Listing of recorded PCAPNG files in the selected time interval of the microburst.
On this basis, we navigate to the Captured Files page, as shown in Figure 9.
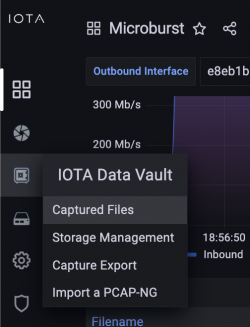
Figure 9: Navigate to the Captured Files page.
In the listing of PCAPNG files, we select the filenames we made a note of earlier and click the download button.
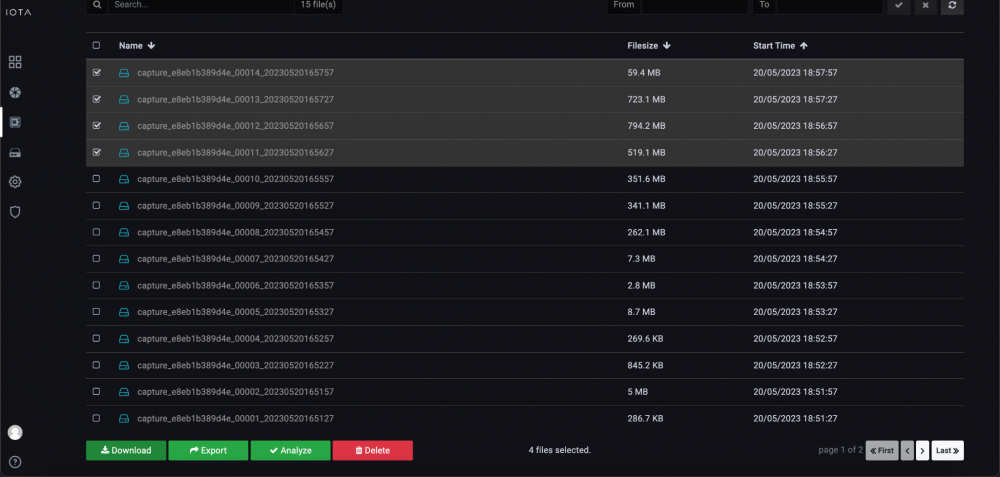
Figure 10: Selection and download of PCAPNG files.
IOTA benefits
The IOTA can detect temporary bottlenecks that common interface workloads on active network components cannot capture due to their coarse measurement time intervals. It also offers the possibility of analyzing this data accordingly with application recognition or making it available for further analysis. Thus, the IOTA provides us with more visibility of bottlenecks for analysis.

