Learn more about the IOTA solution at profitap.com/iota
Problem description
Security analysts and forensic experts often have to analyze which client established connections to specific target systems at what time. Classic perimeter firewalls can log connection attempts from the WAN, but they do not allow lateral movements in the internal network to be detected. Therefore, there is a “blind spot” that needs to be closed.
The following example gives a step-by-step overview of how to analyze connection setups after a security incident with the profitap IOTA. The goal is to identify the host that was infected or that spread the malicious code to an internal file server in the network.
Preparation
For this to be successful, the IOTA must capture traffic on the network before the event occurs so that a retrospective analysis can be performed afterward.
In the first step, we prepare the physical interface. To do this, we navigate to the Capture page using the left menu tree, and then to the Interface Configuration section. The interface is configured as SPAN (out-of-band) with 10/100/1000 Mbit/s Auto Negotiation as shown below, meaning both physical interfaces can receive the traffic to be analyzed from a SPAN port or a TAP.
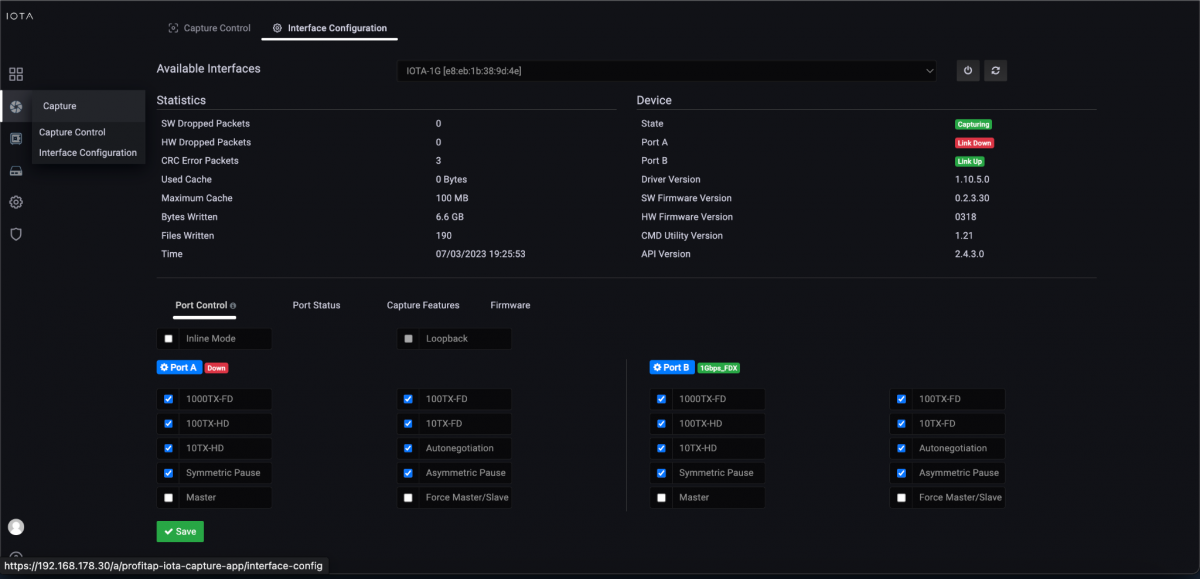
Figure 1: Configuration of the physical interfaces. In this case, 10/100/1000 Mbit/s Auto-Negotiation in SPAN Mode.
Positioning or integration of the IOTA
An uplink of the switch can be used as a SPAN source to include several client VLANs. If the IOTA is to be integrated in-line into the data stream, for example between the access switch and router or access and distribution switch, the checkbox next to Inline Mode must be ticked, and the Save button clicked. This depends on the positioning of the VLAN gateway. In-line operation between the switch and server in the data center would also be conceivable if traffic to and from specific servers is to be recorded in order to be analyzed later.
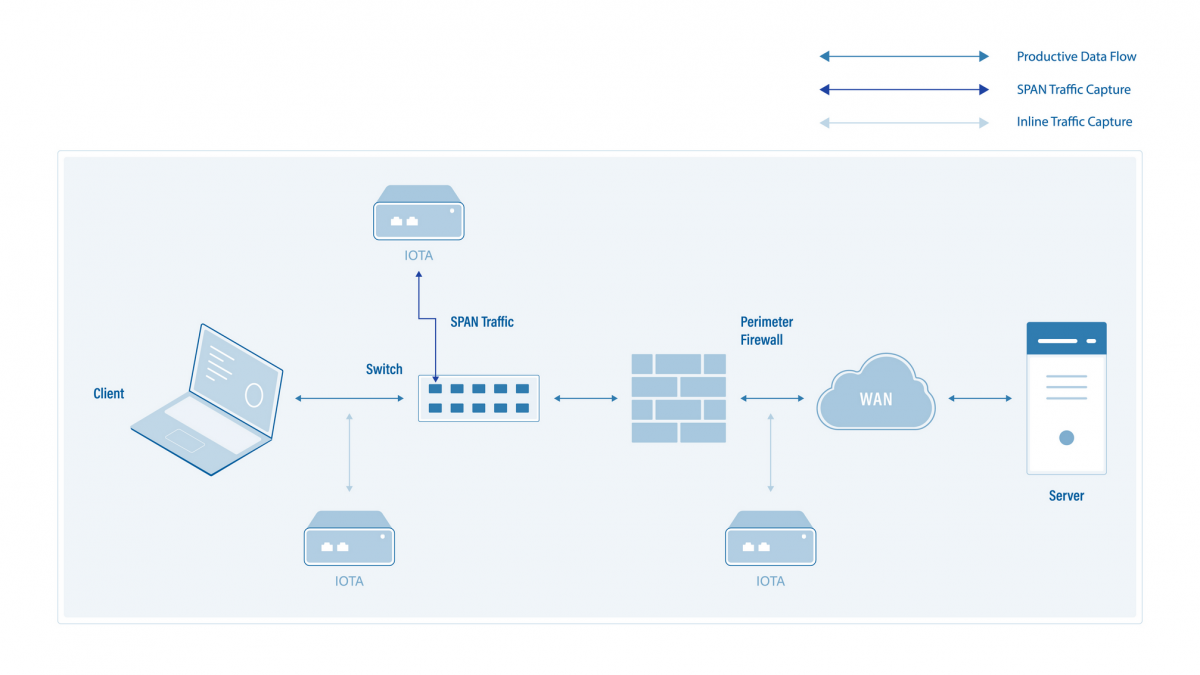
Figure 2: Placement of the IOTA for packet averaging and subsequent security incident analysis.
Start the capture
After placing the IOTA and preparing the physical interface, we connect the appropriate cable, then start the capture process by navigating to the Capture Control section and clicking the Start Capture button at the bottom of the screen. Alternatively, we can start the capture process by pressing the physical Start Capture button on the IOTA device. This speeds up the process and can be done by untrained or non-privileged persons.
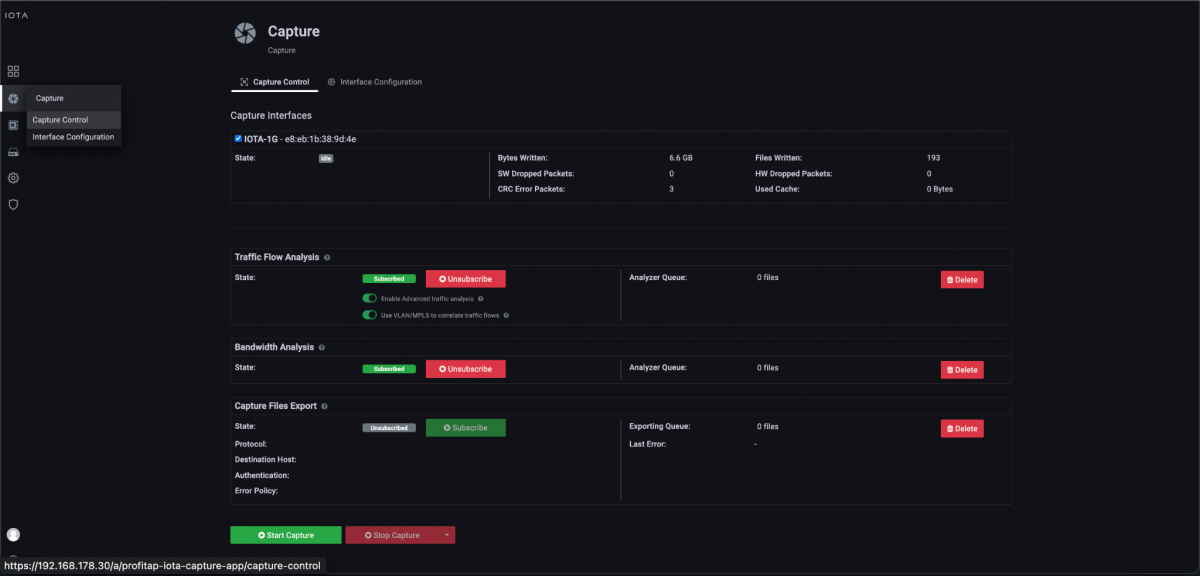
Figure 3: Start the capture using the “Start Capture” button in the “Capture Control” submenu.
Troubleshooting dashboards
To identify the so-called patient zero, we need two approaches. The first is to determine which client has connected to a command and control server (C2) or malware distribution server if known. The second approach uses an affected server or client as a baseline to analyze which other systems have established connections to it.
If it is a known attack, which can be detected by a specific ransomware message, for example, it might be possible to search specifically for communication patterns, such as specific target ports. We use that as an example as well. We assume a ransomware attack on a file server that provided its services via Server Message Block (SMB) on the network. The IPv4 address of the server is 192.168.178.6.
Knowing that SMB operates on TCP port 445, we filter on this destination port on the Overview dashboard and on the previously mentioned IP address 192.168.178.6. In the aftermath, only client 192.168.178.22 had established an SMB connection with the file server during the encryption time window.
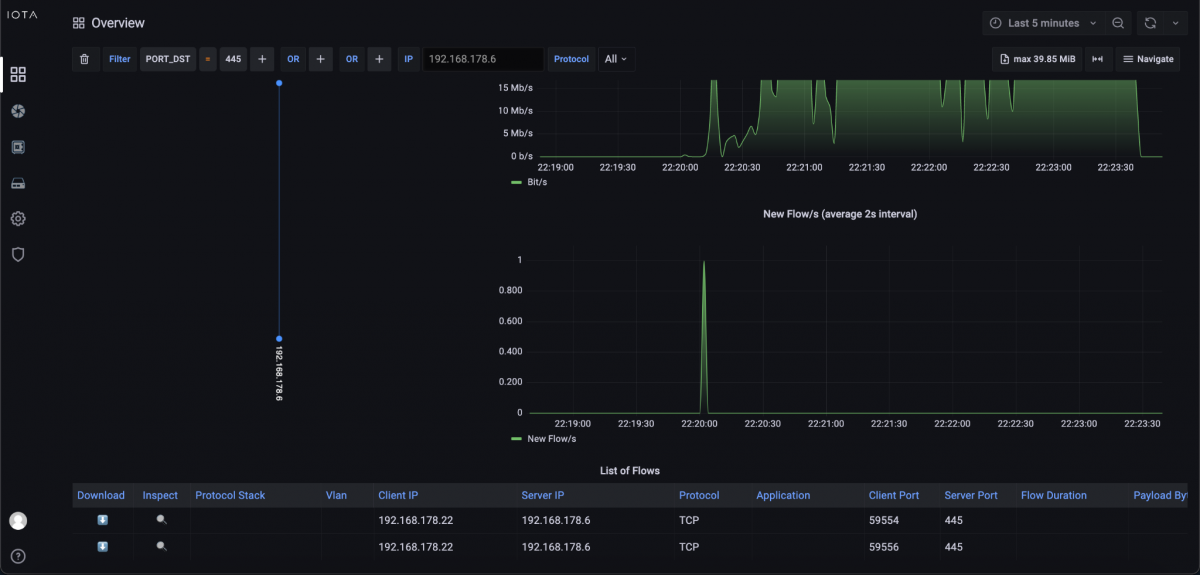
Figure 4: Filters to IP address 192.168.178.6 and destination port 445.
We also check on the Overview dashboard, via the filter “IP_SRC = 192.168.178.22”, which communication relationships were established shortly before by client 192.168.178.22 to clarify whether command and control traffic or a download took place.
At the bottom of the dashboard, we review the filtered flow data in the “List of Flows”. In it, we see that only one communication attempt left the internal network before. Specifically, a TCP connection with TLS on destination port 443, i.e., HTTPS, and the destination IP address 91.215.100.47.

Figure 5: Communication relationships based on the filtered source host at the bottom of the Overview dashboard.
Based on this flow data, we switch to the SSL/TLS Overview dashboard via the Navigate menu at the top right-hand corner of the screen to check with which server name a connection was established. This can be seen in the client hello, or, more concretely, in the TLS extension Server Name Indication (SNI). This contains the hostname with which the client established a connection.
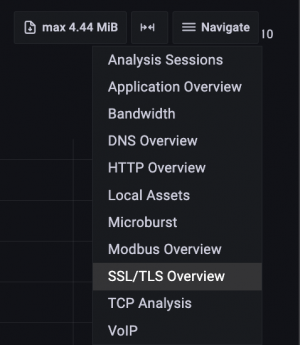
Figure 6: Switching to the SSL/TLS Overview dashboard via the Navigate menu.
In the SSL/TLS Overview dashboard, in the SSL/TLS servers listing, we recognize the associated server name with “config.ioam.de”, with which the client had established a connection.
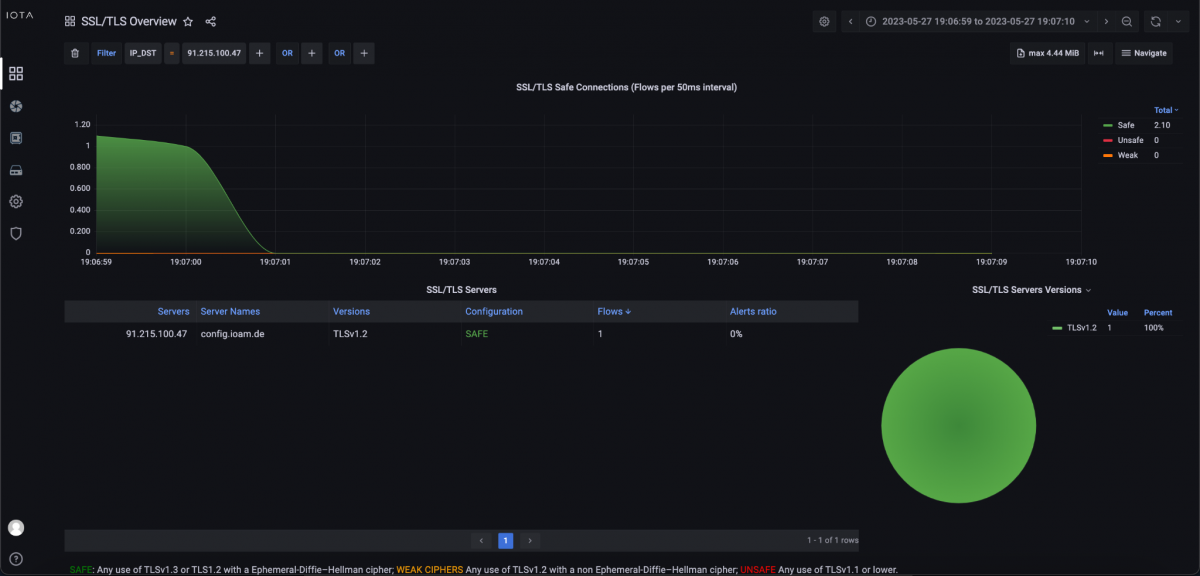
Figure 7: SSL/TLS Overview dashboard in which we can see the server name from the TLS client hello.
Further analysis would have to be done on the client in the log files since the TLS encryption meant that the download itself was not recognizable in plain text. It was then determined that the user had downloaded and installed an application. This executed the encryption process of files over the analyzed SMB network share. Thus, we now had the IP address, hostname, and file that led to the attack. However, in some cases, the servers from which the malware is downloaded are only the “front-end servers” of the attackers, which also change from time to time.
Since lateral movements in the network are often detectable in the case of attacks, other clients should also be checked since the affected client could also have already distributed the malware. If no external communication relationship was visible on the affected client, all internal communication patterns should have been checked for anomalies that could have brought malware to client 192.168.178.22.
If we need to check which hosts attempted to connect to a specific server that seems to provide malicious software, we can also do that with IOTA. If there are known FQDNs that are related to these servers, we could use the DNS Overview dashboard.
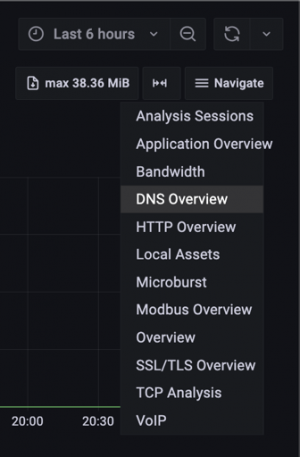
Figure 8: Switch to DNS Overview dashboard via Navigate menu.
We switch to the DNS Overview dashboard and use the Search DNS filter to search by name. We used the domain akamaitechcloudservices.com, which sounds like a connection attempt to a content delivery network, but is known to be a malicious server that is used in a security incident.
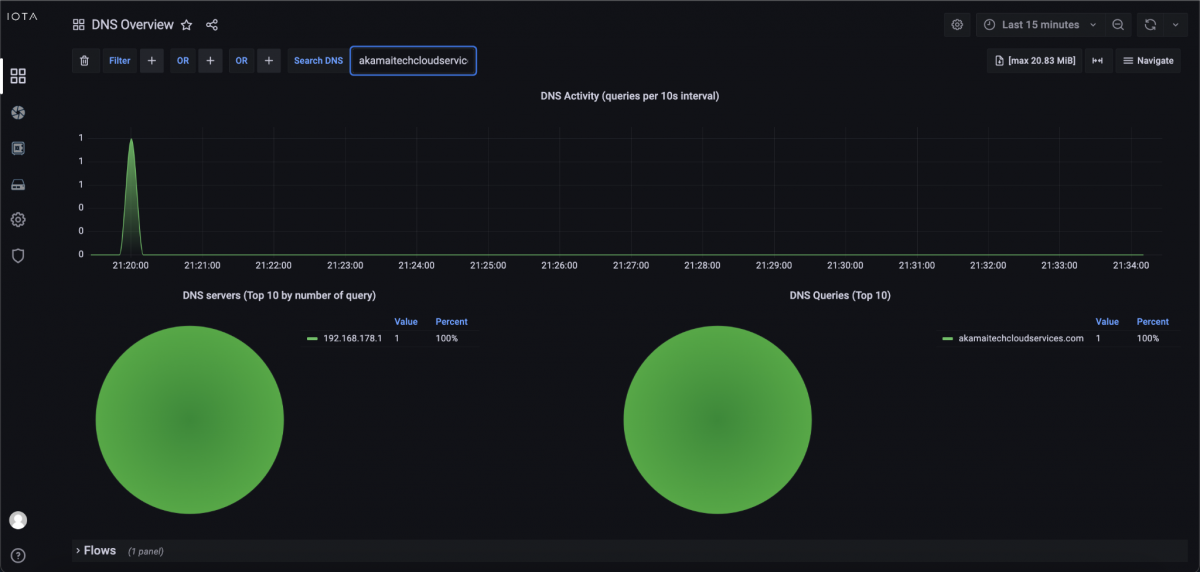
Figure 9: Search by name akamaitechcloudservices.com.
After the search, we can see that the malicious server was requested by DNS at about 9:20 PM. To further investigate which client attempts to connect to this server, we can go down to the DNS Overview dashboard and see the Client IP address which is requesting akamaitechcloudservices.com. In our example in Figure 10, it was 192.168.178.22. Now we know which client tried to connect to this server.

Figure 10: DNS query/response and corresponding flow table.

